The Quarter in Context

BHP’s FY2026 results frame a single fiscal year, not a quarter, but they anchor the investment debate. The company reported $51,238 million of revenue, $19,464 million of operating income (an operating margin of roughly 38.0%), $11,143 million of net income (a net margin of roughly 21.7%), and $18,692 million of operating cash flow for the year ended 30 June 2026. Capital expenditure was $9,398 million, which yielded an accounting free-cash-flow proxy of roughly $9,294 million, or about 18.1% of revenue. Diluted EPS was $1.774, while the auditor (Ernst & Young) delivered an unqualified opinion on the consolidated financial statements and on internal control over financial reporting under PCAOB standards.
The context that surrounds these numbers matters more than the figures themselves. Iron ore, copper, and metallurgical coal are globally priced in U.S. dollars; supply is concentrated in a small number of jurisdictions; and Chinese steel demand remains the swing variable for bulk commodities. The filing explicitly cautions that future revenues depend on commodity prices that may vary materially from current levels, a reminder that a single strong fiscal year is an entry point rather than a normalized earning stream. The dated market snapshot (BHP closing at $88.98 on 18 August 2026, with a market capitalization of $226,071 million) reflects the market’s pricing of these macro uncertainties, not their resolution.
Business Model and Profit Engine
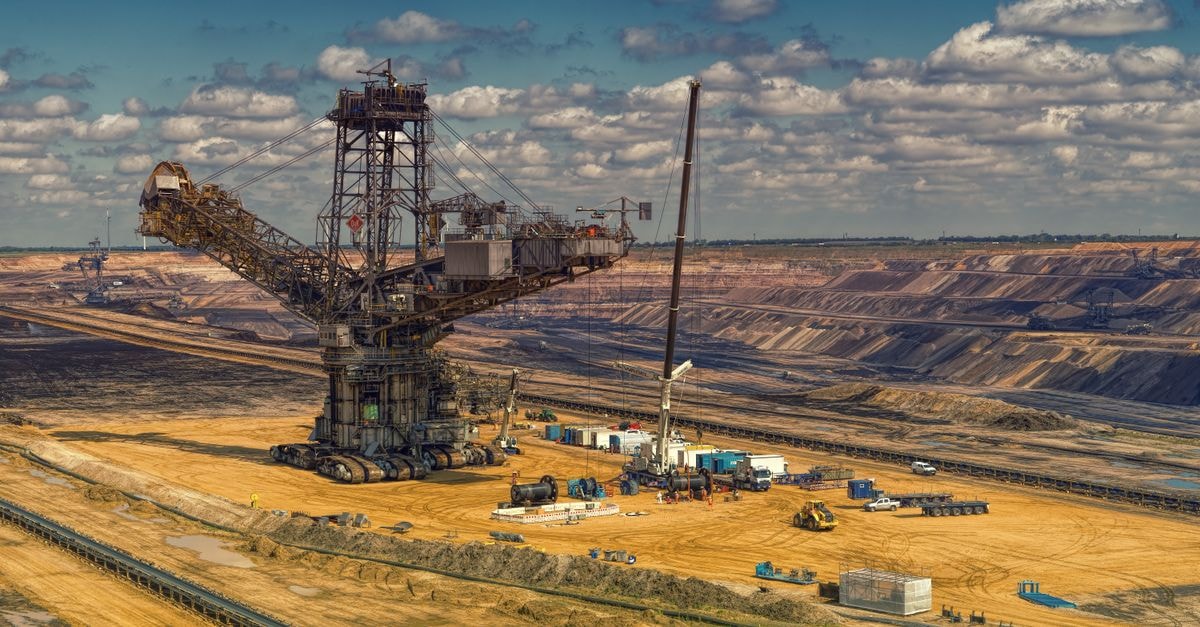
BHP earns its money by extracting iron ore, copper, metallurgical (steelmaking) coal, energy coal, potash, and nickel from long-life, low-cost reserves in Australia, the Americas, and (for potash) Saskatchewan, and selling those commodities into industrial markets at prices set on global exchanges. Customers are large steel mills, smelters, utilities, and agricultural potash distributors; the value they buy is a physical commodity input rather than a service, and revenue is therefore transactional and spot-indexed rather than recurring in a contractual sense. The principal revenue engines by commodity are copper, iron ore, and coal, with potash and nickel still in earlier stages of contribution. The filing reports results by commodity segment in Performance by Commodity (OFR 7.1 to 7.5), which is the closest the filing offers to segment economics in the available evidence.
The path from revenue to cash follows a standard resource model. Revenue passes through operating costs (labor, energy, rail, port, diesel, royalties) to reach operating income, which is converted into operating cash flow after taxes, working-capital movements, and other items, then reduced by capital expenditure for sustaining mines and growth projects. The accounting FCF proxy of about $9.3 billion on roughly $51.2 billion of revenue implies that BHP converts close to one-fifth of its top line into free cash before financing, a striking figure for a capital-intensive business. Operating margin of roughly 38% is consistent with mid-cycle bulk-commodity economics. Pricing power is structural rather than transactional: BHP cannot set iron-ore or copper prices, but its position on the global cost curve means realized prices flow through to cash relatively intact at high utilization, and would compress in a downturn.
Fixed versus variable cost structure is hard to read from the available evidence; the filing does not separate maintenance from growth capital expenditure (a data gap), and inventory, accounts receivable, and detailed working-capital lines were not in the available SEC data. A $2,300 million impairment on the Jansen potash CGU and a $1,071 million (pre-tax) loss recognized on Samarco provisions in FY2026 both highlight that mid-cycle reported earnings still absorb non-cash and provisions charges tied to specific assets and legacy liabilities. A later 18 August 2026 transaction with Global Infrastructure Partners brought in $2 billion of funding for a 49% interest in the WAIO inland-power infrastructure, an example of asset-level capital recycling rather than a fundamental shift in the profit engine.
Earnings Quality and Cash Conversion
Earnings quality looks solid on the headline metrics. Operating income of $19,464 million on $51,238 million of revenue translates to a ~38% operating margin and net income of $11,143 million to a ~21.7% net margin, both well above the median diversified miner. The auditor flagged impairment testing for property, plant and equipment ($80,046 million carrying value), closure and rehabilitation provisions ($11,598 million), and Samarco provisions ($5,197 million) as critical audit matters because they require judgments about future commodity prices and discount rates; that is, the reported margin depends on assumptions about the future, not just past prices.
Cash conversion is the more meaningful lens. Operating cash flow of $18,692 million against $19,464 million of operating income implies modest non-cash add-backs (depreciation, impairments) and limited working capital drag in the year, while the $9,398 million of capital expenditure yields an accounting FCF proxy of about $9,294 million, or 50% of operating cash flow. That ratio is heavy by software-style standards, but in line with large-scale mining where capital intensity is structural. The available SEC data does not separate maintenance from growth capex, so the $9.3 billion figure cannot be read as distributable free cash without further information; labeling it an "accounting FCF proxy" is the most the evidence will support. The board’s policy of a 50% minimum dividend payout on underlying attributable profit anchors the share of cash returned.
Business Quality, Moat, and Industry Position
BHP’s competitive position is built on reserve scale and cost position rather than product differentiation. The Chair’s review emphasizes "large, long-life and low-cost world-class assets in attractive commodities," paired with the BHP Operating System as an internal management discipline. In a long-commodity market, that combination normally produces wide margins and resilient cash flows; in a short-commodity market, the same cost position limits downside but does not eliminate it, because demand-side cyclicality (especially Chinese steel demand) dominates realized price. A second-order moat is logistics integration: rail and port infrastructure at Western Australia Iron Ore (WAIO) and integrated copper operations at Escondida tie BHP’s volumes to specific basins that competitors cannot replicate quickly. The auditor’s identification of impairment-indicator testing across all CGUs, with one Jansen impairment, suggests management is applying, not avoiding, downward marks in weaker segments.
The industry is concentrated upstream (a small number of diversified majors plus a long tail of single-asset producers), fragmented midstream (rail, port, custom smelters) and atomized downstream (steel mills, chemical distributors). BHP sits at the upstream end with a sizeable share of seaborne iron ore and material share of seaborne metallurgical coal and copper concentrate. Order visibility is low because commodity contracts are short and prices are externally set; bottleneck strength depends on reserve quality, not contractual lock-in. The new GIP arrangement on WAIO inland power shows that infrastructure capital can be partially recycled, but is a financing transaction rather than a moat expansion.
Management and Capital Allocation
The Capital Allocation Framework (CAF) is the stated discipline: projects compete for capital against a hurdle, and a 50% minimum dividend payout on underlying attributable profit is a board-level floor. For FY2026, dividends totaled 172 US cents per share, an increase of 62 cents over FY2025, with a stated $8.7 billion total distribution. A CEO transition occurred on 1 July 2026, with Brandon Craig replacing Mike Henry; six-and-a-half-year incumbent Henry’s tenure was characterized in the filing as a period of operational excellence and portfolio refocus toward "future-facing commodities". The Chair’s review notes a Tier 1 portfolio framing without specific strategic targets, which is a discipline cue rather than a forecast.
The structure of capital return is heavily dividend rather than buyback; the available SEC data does not disclose a comparable repurchase magnitude, and absent that data, buybacks cannot be quantitatively weighed against dividends here (a data gap). The GIP $2 billion transaction on WAIO inland power brought in a 49% minority partner and $2 billion of funding while retaining operational control: this is capital recycling rather than net new reinvestment, and is a constructive sign if the cost of capital is attractive. The $2,300 million Jansen impairment and the $1,071 million Samarco pre-tax loss are reminders that capital allocation also generates write-downs; both are filed as critical audit matters and so should be treated as estimates subject to material change.
Valuation and What the Market Already Expects
The dated market capitalization of $226,071 million at $88.98 per share (18 August 2026) sits roughly 10.6% above the deterministic base case (a $204.3 billion implied fair market capitalization at $80.42 per share using an 8% first-five-year FCF growth assumption). It also sits well below the bull case (an implied $319.4 billion / $125.72 per share) and well above the bear case (an implied $107.3 billion / $42.22 per share). The reverse-DCF implied growth embedded in the dated market capitalization is roughly 7.6%, which is meaningful given that the base case assumes 8% in the first five years. The market is essentially paying for a moderated version of the base case, with the dividend floor providing partial downside cushion.
Reported diluted EPS of $1.774 for the year (not the quarter, and not a trailing-twelve-month figure over a non-fiscal-year boundary) is not described here as a P/E denominator against a single quarter. Capital intensity remains the principal valuation burden: a $9.3 billion accounting FCF proxy against a $226 billion market capitalization implies a roughly 4.1% accounting FCF yield, before any credit, debited, or other balance-sheet adjustment; same-date net-cash data is unavailable, so no balance-sheet bridge is added (a data gap). The current price does not provide a wide structural margin of safety against a sustained commodity downturn; the deterministic bear case would imply a price closer to $42 per share, around half the dated level. The interplay between dividend-supported downside, mid-cycle FCF generation, and concentrated cyclical exposure is therefore the central valuation issue.
Ten-Year Cash Flow to Fair Market Value
The starting free cash flow is the normalized SEC cash-flow proxy, while every growth rate, discount rate and terminal rate below is an explicit editorial assumption rather than company guidance. Each annual cash flow is forecast and discounted separately; terminal value is year-ten free cash flow multiplied by one plus terminal growth, divided by discount rate minus terminal growth, and then discounted back ten years. Fair market capitalization equals that explicit ten-year present value plus discounted terminal value and a same-date balance-sheet adjustment when available. If current cash and debt facts do not share one report date, the table shows the adjustment as unavailable and conservatively applies zero. The share count is derived from the dated market capitalization and share price so US shares and foreign ADRs use a consistent traded-security denominator.
Year | Bear FCF | Base FCF | Bull FCF |
|---|---|---|---|
1 | $9.48B | $10B | $10.6B |
2 | $9.67B | $10.8B | $12.1B |
3 | $9.86B | $11.7B | $13.8B |
4 | $10.1B | $12.6B | $15.7B |
5 | $10.3B | $13.7B | $17.9B |
6 | $10.5B | $14.2B | $18.8B |
7 | $10.8B | $14.8B | $19.8B |
8 | $11.1B | $15.4B | $20.8B |
9 | $11.4B | $16B | $21.9B |
10 | $11.7B | $16.6B | $23.1B |
Scenario | Growth years 1–5 / 6–10 | Discount | Terminal | 10-year PV | Terminal PV | Balance-sheet adjustment | Fair market cap | Fair value/share | Margin of safety | Terminal share |
|---|---|---|---|---|---|---|---|---|---|---|
Bear | 2.0% / 2.7% | 11.0% | 2.0% | $60.6B | $46.7B | N/A (treated as $0) | $107B | $42.2 | -110.7% | 43.5% |
Base | 8.0% / 4.0% | 9.0% | 3.0% | $83.8B | $120B | N/A (treated as $0) | $204B | $80.4 | -10.6% | 59.0% |
Bull | 14.0% / 5.2% | 8.5% | 3.5% | $108B | $211B | N/A (treated as $0) | $319B | $126 | 29.2% | 66.1% |
In the reverse-DCF, holding the 9% discount rate and 3% terminal growth fixed, and solving only for one constant growth rate rather than using the base-case growth path, the current market capitalization implies roughly 7.6% annual free cash flow growth for ten years. This is a sensitivity framework, not a price target: the terminal-value share shows how strongly each result depends on assumptions beyond the explicit forecast. Negative margin of safety means the current market capitalization exceeds the scenario value.
Five Value-Investing Lenses
Benjamin Graham Lens
Graham’s lens starts with the balance sheet. From the available evidence, same-date cash and total debt were not in the package (data gap; the most recent cash snapshot is at 30 June 2025), so a clean current net-cash/net-debt figure cannot be computed and no current ratio is quoted. The 30 June 2025 cash snapshot of $11,894 million against stockholders’ equity of $52,218 million is one input, but that balance-sheet position is pre-FY2026 cash generation. Graham would also want normalized earnings rather than a peak-cycle figure; the FY2026 results could reflect a strong commodity window, and the filing explicitly cautions that revenue depends on prices that may vary significantly. A "famous company at lower price" is not by itself evidence of cheapness.
In margin-of-safety language: the deterministic base case implies a fair value of $80.42 per share against a dated $88.98, with no structural downside cushion in a bear scenario that would map to roughly $42 per share. Graham would treat the dated price as offering at best a thin margin of safety for a cyclical; the dividend minimum of 50% of underlying attributable profit provides a partial backstop, but only in the absence of severe dividend-currency or commodity stress. The capital allocation framework and the auditor’s unqualified opinion are supportive, but Graham’s normal test for a defensive equity is not satisfied without a clearer balance-sheet snapshot.
Benjamin Franklin Lens
Franklin’s modern application here is about capital discipline and opportunity cost. BHP’s CAF treats every investment dollar as competing against alternatives, and the minimum 50% dividend payout prioritizes compounding for shareholders over reinvestment at any return, a thrift-like discipline when measured against the supplier of risk capital. The $2,300 million Jansen impairment and $1,071 million Samarco pre-tax loss in FY2026 show that discipline has produced some costly outcomes; the opportunity cost of capital deployed into Jansen, rather than returned or redeployed, is a live trade-off the filing acknowledges indirectly through the critical audit matter language.
The opportunity cost test extends beyond the company: an investor at $88.98 is implicitly choosing BHP’s commodity-linked earnings stream over every alternative use of that dollar, including other miners with different commodity mixes, different jurisdictional risk, and different payout policies. The deterministic bear case at ~$42 per share is the relevant counterfactual: half the dated price. Dividend-supported compounding at a 50% minimum payout can be a reasonable cushion in flat markets, but it is not a substitute for a price that already reflects mid-cycle economics, and the dated market capitalization is currently slightly above the base model. Capital discipline and opportunity cost together suggest the dated price is fair, not cheap.
Warren Buffett Lens
Buffett would ask whether BHP generates owner-style cash that supports long-term per-share value, and how management allocates that cash.Reported TTM operating cash flow less total reported capital expenditure produces an accounting free-cash-flow proxy of $9.3 billion. The filings do not separate maintenance from growth capital expenditure, so a precise Buffett-style owner-earnings estimate is unavailable. The dividend floor and CAF sit near the kind of framework Buffett would expect, and the auditor’s unqualified opinion on internal control satisfies the integrity check. The GIP transaction on WAIO inland power is a value-unlocking move if the cost of capital is favorable; reading $2 billion of funding as wholly accretive would require knowing the cost-of-capital differential, which the filing does not give.
Buffett would also ask about moat durability. Iron ore, metallurgical coal, and copper are cyclical but tied to specific basins; a Tier 1 reserve base is a real economic advantage, though it can be replicated over decades by competitors with capital, time, and political permission. The owner-style view would credit BHP for cost position and reserve longevity, but would discount the value of any commodity-cycle forecast as inherently speculative. The reverse-DCF implied growth of 7.6% sitting near the base case assumption of 8% says the market is fairly compensating for that view, not overpaying.
Charlie Munger Lens
Munger would invert the question: what would have to go right for the dated price to compound from here, and what could break the thesis? Required for the bull path: sustained Chinese steel demand, no major additions of low-cost iron-ore or copper supply outside of BHP’s control, no material adverse regulatory or tax action against Australian or Chilean assets, and continued capital-discipline execution by a new CEO. The thesis breakers are observable: a step-change in Chinese property and infrastructure demand; new seaborne iron-ore supply from West Africa or India; a damaging event at a single high-cost asset (the auditor’s impairments and Samarco provisions demonstrate this is not a hypothetical); and any extended period where the FCF proxy is materially below the $9.3 billion base. Sentinel safety incidents at the BMA Peak Downs mine (a contractor fatality reported in the filing’s opening) are a non-financial indicator that operations risk is present.
Incentives matter. The minimum 50% dividend payout aligns the board and shareholders on cash return rather than empire-building, and the CAF has a stated hurdle. The CEO transition disrupts tenured relationships with operations and stakeholders; Munger would want observable evidence over the next two fiscal years that the new management team preserves the cost and capital-discipline culture. Munger’s bias check: a headline-grabbing Tier 1 narrative can dull the attention needed for closure-provision estimates or second-order impairments; both are already flagged in the filing, so this is a manageable, not fatal, concern.
Li Lu Lens
Li Lu would examine circle of competence, culture, and permanent-loss protection. BHP is inside an investor’s competence if they understand bulk commodity cycles, Chinese industrial demand, and jurisdictional risk in Australia and Chile; outside that circle, the asset looks like a price chart. Culture, as observable conduct, includes the CAF, the dividend floor, the capital recycling via GIP, the willingness to take a $2.3 billion Jansen impairment, and the willingness to disclose and provision for Samarco ($5,197 million provision, $1,071 million pre-tax loss in FY2026). These are signals that management is not concealing problems, though they are not signals of profit quality itself.
Permanent-loss protection is the binding constraint. The most plausible permanent-loss path is a sustained commodity downturn combined with a balance-sheet event, where the dividend is cut and capital is preserved by deferring growth; the deterministic bear case implies that path would map to roughly $42 per share, around half the dated price. A second permanent-loss path is a high-impact safety, environmental, or tailings failure, which the auditor flags through critical audit matters on closure and rehabilitation provisions. The dated price offers limited margin of safety to absorb either path; dividend-supported compounding is the principal protection, but it does not fully offset cyclical risk.
Risks, Disconfirming Evidence, and What Would Prove This Thesis Wrong
Prominent growth narratives can amplify attention bias and the price investors are willing to pay before cash flows arrive. That does not negate the operating evidence, but it raises the burden of proof for valuation and makes execution shortfalls more costly. Three observable thesis breakers would force a downward revision. First, a sustained price decline in iron ore or copper that compresses the FCF proxy materially below $9.3 billion for multiple years, indicating the dated earnings power is a cycle peak rather than a mid-cycle level. Second, material adverse regulatory or tax action against Australian, Chilean, or Brazilian operations (including the equity-accounted Samarco investment) that raises effective taxes, royalties, or production restrictions. Third, a high-impact safety, environmental, or tailings incident at a Tier 1 asset that triggers contingent liability well beyond the existing $11,598 million closure and rehabilitation provision and $5,197 million Samarco provision.
Disconfirming evidence in the available SEC data includes the auditor-flagged impairments, the $1.071 billion pre-tax Samarco loss, and a CEO transition within days of the filing date. Data gaps that could move the conclusion include missing segment revenue and FCF contributions by commodity, missing same-date cash and total debt, and the absence of disclosed maintenance versus growth capex separation. The market-derived share count of roughly 2,540.7 million ordinary-equivalent shares is inferred from the dated market capitalization and price and is not a period-end share count; that distinction matters if a per-share valuation is constructed outside the available scenario.
Investment Conclusion
BHP is a high-quality, capital-intensive, commodity-cyclical business whose FY2026 margins and accounting free cash flow place it near the top of its peer group, but whose valuation at $88.98 per share and a dated market capitalization of $226,071 million offers only a thin margin of safety against a deterministic bear scenario mapped to roughly $42 per share. The dividend-supported floor (50% minimum payout) and disciplined CAF are real positives, but they do not offset a cycle that turns materially against the company. The deterministic base case implies a fair market capitalization of roughly $204.3 billion and the market is paying slightly above that, which is consistent with a fairly valued rather than undervalued position at this date.
Investment conclusion: fairly valued, with the dividend floor and Tier 1 portfolio justifying a watchlist rather than a buy, and a clear entry point contingent on a credible cyclical drawdown that compresses the FCF proxy for multiple years or produces an observable thesis-breaker from the list above. The 18 August 2026 dated market snapshot is the relevant pricing reference; the FY2026 annual results are the relevant operating reference, not a trailing quarterly figure.
*This article is for educational purposes only and does not constitute investment advice or a recommendation to buy, sell, or hold any security. Past performance is not a guide to future performance; commodity-linked equities are subject to material cyclical and jurisdictional risk. *
Share this article