The investment case — and what could go wrong
- The Cheesecake Factory Incorporated reported second-quarter fiscal-2026 revenue of $1,029.6 million, up 7.7% from $955.8 million in the prior-year quarter.
- Revenue is therefore overwhelmingly transactional and in-person dining, augmented by wholesale bakery volume and licensee royalties, with no subscription or contracted recurring line disclosed in the filings.
- The clearest threats to durability are consumer discretionary spending compression, labor and commodity inflation resurfacing, and restaurant-level concept underperformance (especially for North Italia and Flower Child), all of which are flagged in the risk-factor section.
Selected from this article · 2026-10-18
Read on for the full pictureThe Quarter in Context
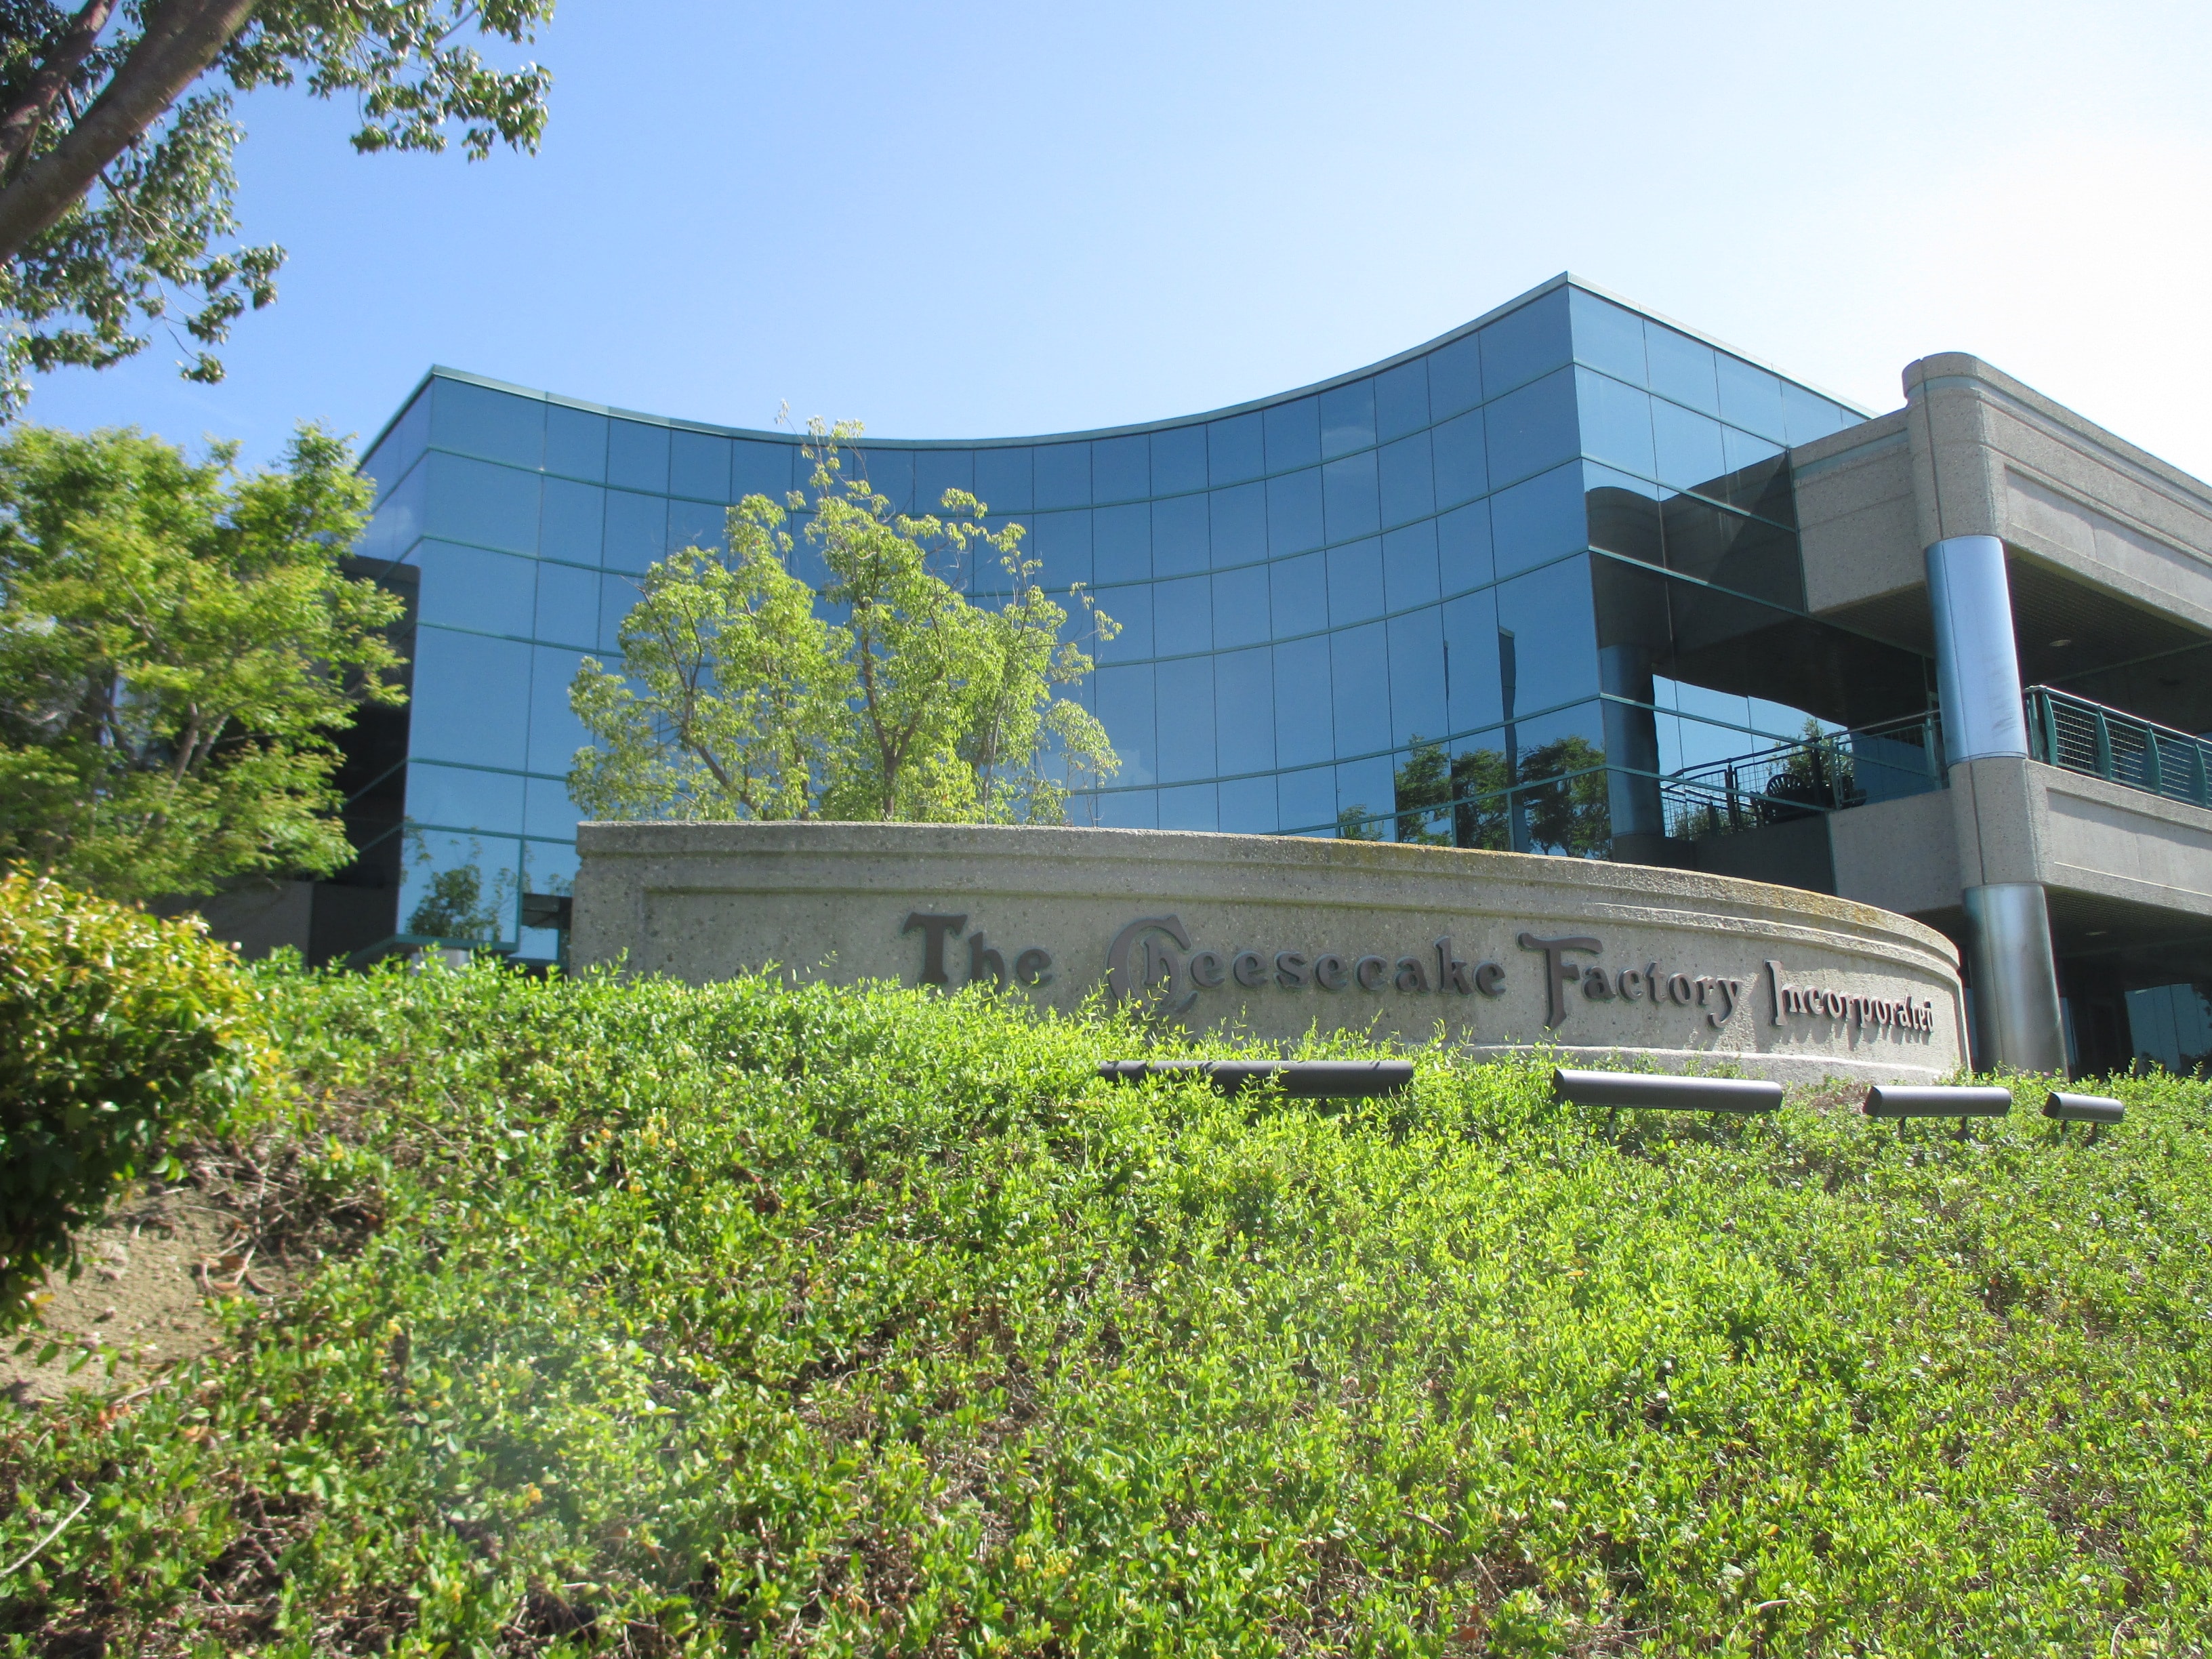
The Cheesecake Factory Incorporated reported second-quarter fiscal-2026 revenue of $1,029.6 million, up 7.7% from $955.8 million in the prior-year quarter. Operating income reached $78.6 million, an increase of 21.3% versus $64.8 million a year earlier. Net income of $68.4 million produced diluted earnings per share of $1.41 on 48.5 million weighted-average diluted shares, compared with $1.14 in the prior-year quarter. The twenty-six-week cumulative view shows revenue of $2,008.5 million against operating income of $133.7 million, indicating the quarter was not a one-off result.
The operating lift was driven by top-line growth flowing through to operating profit, even with food-and-beverage cost, labor expense, and other operating costs all expanding in dollar terms. Capital intensity remains visible: additions to property and equipment of $86.3 million in the first half of fiscal 2026 versus $84.4 million in the prior-year period. Management states it expects up to 26 new restaurants in fiscal 2026 and roughly $210 million of total capex, blending new-unit construction with maintenance on existing restaurants and bakery and corporate investments. The shape of the quarter, then, is healthy top-line and operating profit growth alongside a clearly stated reinvestment program.
Business Model and Profit Engine
Customers pay cash or cash equivalents at the point of sale for food and beverage across 368 company-operated restaurants. The portfolio consists of four owned concepts: The Cheesecake Factory (216 locations as of February 23, 2026), North Italia (48), Flower Child (43), and Other Fox Restaurant Concepts brands (55). Internationally, 35 additional Cheesecake Factory restaurants operate under licensing agreements, and two bakery facilities produce cheesecakes and baked goods for company restaurants, licensees, and third-party customers. Revenue is therefore overwhelmingly transactional and in-person dining, augmented by wholesale bakery volume and licensee royalties, with no subscription or contracted recurring line disclosed in the filings.
Revenue becomes operating profit through fixed-cost leverage on restaurant labor, occupancy (sitting largely on the balance sheet as operating lease liabilities of $1,346.1 million long-term and $172.0 million current), and shared corporate overhead. Within the second-quarter income statement, food and beverage costs were $223.8 million (about 21.7% of revenue), labor expenses were $351.5 million (about 34.1%), and other operating costs were $272.7 million (about 26.5%), with general and administrative expenses of $65.6 million and depreciation and amortization of $29.1 million. The filings do not disclose gross profit or segment-level contribution, so the precise gross-margin level is a stated data gap; visible is that second-quarter operating margin reached roughly 7.6% of revenue on $1,029.6 million. Variable costs (food, hourly labor, restaurant-level supplies) scale with covers; fixed costs (salaried labor, rent, depreciation, corporate G&A) do not, so the model carries operating leverage as same-store sales rise and pressure when they fall.
Working capital is structural-light because customers largely pay on the cash register. Inventory of $50.5 million (food, bakery finished goods, and raw materials) is modest relative to revenue, accounts payable of $70.7 million is in normal range, and gift card liabilities of $183.5 million at quarter-end represent an interest-free float rather than a working-capital strain. Capital intensity is visible but disclosed only in aggregate: management guides to roughly $210 million of full-year fiscal-2026 capex, blending new-unit construction with maintenance on existing restaurants and bakery and corporate investments, while the filings do not separate maintenance from growth capex. Unit-level economics are not separately disclosed by concept, and supplemental metrics such as average-unit volumes and restaurant-level margin remain a stated data gap. Observable conditions that would weaken the profit engine include deteriorating labor-to-sales or food-to-sales ratios, rising preopening costs relative to new-unit productivity, and any sustained same-store sales contraction at the flagship Cheesecake Factory brand, all of which the filings highlight as risk factors without quantifying at the segment level.
Earnings Quality and Cash Conversion
Where the issuer reports cash flow and capital expenditure cumulatively, the standalone-quarter cash-flow figures are derived by subtracting the preceding cumulative filing. They are calculations from SEC facts rather than separately reported quarterly line items.
The standalone-quarter cash-flow figures discussed below are derived by subtracting the preceding cumulative filing; they are calculations from reported SEC facts rather than separately reported quarterly line items.
First-half fiscal-2026 cash provided by operating activities was $188.9 million, up from $135.8 million in the prior-year period. Net income for the same period was $117.9 million, with non-cash depreciation and amortization of $57.1 million and stock-based compensation of $15.8 million, both of which support cash conversion; deferred income taxes added $8.1 million while changes in operating lease assets and liabilities absorbed $7.6 million and gift-card liabilities released $29.4 million. The single-quarter operating cash flow of $92.2 million is a derived calculation because it was reported on a cumulative basis. Property and equipment additions of $42.9 million for the quarter are likewise derived from the reported $86.3 million of first-half additions.
Subtracting total capex from operating cash flow gives a single-quarter accounting free-cash-flow proxy of about $49.3 million for the quarter, and a trailing-twelve-month proxy of $206.3 million. The filings do not split maintenance from growth capex, so this is an accounting measure and cannot be labelled an owner-earnings figure without that reservation. Working capital is benign, as discussed above, and stock-based compensation of $15.8 million in the first half plus deferred-consideration payments of $13.2 million related to the Fox Restaurant Concepts acquisition are recurring non-cash or quasi-cash items that reduce but do not impair cash quality.
Business Quality, Moat, and Industry Position
Cheesecake Factory is best described on the available evidence as an important participant in casual dining rather than a demonstrated core supply-chain bottleneck. This classification describes strategic position only and is not independent proof of a moat or valuation upside.
The Cheesecake Factory brand, founded in 1972 and incorporated in 1992, has a more than forty-year operating history that underpins its experiential dining identity. The moat evidence available in the filings rests on three observable pillars: brand recognition (the Cheesecake Factory trademark is licensed internationally through 35 restaurants); menu breadth (an unusually large in-restaurant menu that functions as a switching cost once a guest has navigated it); and a multi-concept portfolio that internalizes growth via North Italia, Flower Child, and Other FRC rather than relying on a single brand. Two bakery facilities produce cheesecakes and baked goods for company restaurants, licensees, and third-party customers, providing an additional supply-and-margin advantage that competitors must replicate.
Operating-lease finance is itself a scale phenomenon: the $1,346.1 million long-term operating lease liability and lease assets of $1,470.8 million reflect an estate of 368 restaurants with presumably cross-defaulted landlord relationships. The Revolver Facility covenants (a maximum Net Adjusted Leverage Ratio of 4.25x and a minimum EBITDAR-to-interest-and-rent ratio of 1.90x) demonstrate how a casual-dining operator's credit profile is dual-keyed to lease-adjusted leverage, not just funded debt. The clearest threats to durability are consumer discretionary spending compression, labor and commodity inflation resurfacing, and restaurant-level concept underperformance (especially for North Italia and Flower Child), all of which are flagged in the risk-factor section.
Management and Capital Allocation
Management is led by founder David Overton as Chairman and CEO and by CFO Matthew E. Clark, a long-tenured team. In the first half of fiscal 2026, the company returned approximately $59.3 million of capital: $29.9 million in common stock dividends (a steady $0.30 per share per quarter, declared against $0.27 in the prior-year period) and $29.4 million of treasury repurchases at an average of $58.18 to $63.80 per share during the quarter. Total return-of-capital initiatives plus the $68.0 million repayment of maturing 2026 convertible notes plus a $69.0 million repayment on long-term convertible debt including premium offset by option proceeds of $7.3 million defined the financing line of the cash-flow statement.
The capital structure is dominated by $562.9 million of net long-term debt in the form of 2030 convertible senior notes, against a $400 million undrawn revolver with $33.5 million in letters of credit and $366.5 million of net availability. Share repurchases are explicitly governed by a ratio test embedded in the loan agreement, which limits buyback discretion when operating cash or financial-covenant headroom is constrained. The combination of growth capex (about $210 million guided for fiscal 2026), continuing dividends, and modest buybacks while paying down the old convertible and retaining cash supports a long-cycle compounding strategy. The cumulative 60.4 million treasury shares at $2,012.1 million cost since inception indicates aggressive historical per-share discipline. Stock-based compensation is real (about $15.8 million in the first half ) and growing, but it remains under 1% of revenue, indicating limited dilution pressure relative to the scale of share retirement.
Valuation and What the Market Already Expects
The dated market snapshot is $116.59 per share on a market capitalization of $5,801,592,318 as of October 18, 2026. On the available normalized base, trailing-twelve-month operating cash flow of $354.4 million less reported capex of $148.1 million yields an accounting free-cash-flow proxy of $206.3 million. That figure implies a free-cash-flow yield of roughly 3.6% on the dated equity value. Same-date cash of $195.2 million is insufficient to net against the funded debt position without a same-date debt snapshot, so the enterprise-value bridge cannot be closed at a single report date; the qualitative implication, however, is that the dated equity price sits above the available cash-flow base and embeds expectations for sustained unit growth, modest same-store sales growth, and margin durability. The dated price therefore offers limited visible margin of safety on the available normalized cash flow, which is the principal valuation burden an investor must clear.
Ten-Year Cash Flow to Fair Market Value
The starting free cash flow is the normalized SEC cash-flow proxy, while every growth rate, discount rate and terminal rate below is an explicit editorial assumption rather than company guidance. Each annual cash flow is forecast and discounted separately; terminal value is year-ten free cash flow multiplied by one plus terminal growth, divided by discount rate minus terminal growth, and then discounted back ten years. Fair market capitalization equals that explicit ten-year present value plus discounted terminal value and a same-date balance-sheet adjustment when available. If current cash and debt facts do not share one report date, the table shows the adjustment as unavailable and conservatively applies zero. The share count is derived from the dated market capitalization and share price so US shares and foreign ADRs use a consistent traded-security denominator.
Year | Bear FCF | Base FCF | Bull FCF |
|---|---|---|---|
1 | $202M | $215M | $227M |
2 | $198M | $223M | $250M |
3 | $194M | $232M | $275M |
4 | $190M | $241M | $302M |
5 | $186M | $251M | $332M |
6 | $189M | $259M | $349M |
7 | $191M | $266M | $366M |
8 | $194M | $274M | $385M |
9 | $197M | $283M | $404M |
10 | $199M | $291M | $424M |
Scenario | Growth years 1–5 / 6–10 | Discount | Terminal | 10-year PV | Terminal PV | Balance-sheet adjustment | Fair market cap | Fair value/share | Margin of safety | Terminal share |
|---|---|---|---|---|---|---|---|---|---|---|
Bear | -2.0% / 1.3% | 11.0% | 2.0% | $1.15B | $0.795B | N/A (treated as $0) | $1.94B | $39 | -198.9% | 41.0% |
Base | 4.0% / 3.0% | 9.0% | 3.0% | $1.59B | $2.11B | N/A (treated as $0) | $3.7B | $74.3 | -56.9% | 57.1% |
Bull | 10.0% / 5.0% | 8.5% | 3.5% | $2.08B | $3.88B | N/A (treated as $0) | $5.96B | $120 | 2.7% | 65.1% |
In the reverse-DCF, holding the 9% discount rate and 3% terminal growth fixed, and solving only for one constant growth rate rather than using the base-case growth path, the current market capitalization implies roughly 9.5% annual free cash flow growth for ten years. This is a sensitivity framework, not a price target: the terminal-value share shows how strongly each result depends on assumptions beyond the explicit forecast. Negative margin of safety means the current market capitalization exceeds the scenario value.
Five Value-Investing Lenses
Benjamin Graham Lens
The Graham test emphasizes balance-sheet resilience and a margin of safety relative to normalized earning power. Cheesecake Factory carries $562.9 million of long-term debt and has only $195.2 million of cash, with the rest of capital sitting in operating lease liabilities. Stockholders' equity is $519.0 million, restrained by a $2,013.2 million treasury stock contra-account; this is structurally consistent with a serial repurchaser rather than an over-capitalized balance sheet. Free cash flow of $206.3 million on the trailing-twelve-month basis is positive and growing, satisfying the downside-profitability criterion, but the dated price of $116.59 implies a market capitalization of $5.80 billion that is well above the available base case, so the discipline of buying below a conservatively normalized cash value is not met on the dated entry point. Graham would treat the dated price as a speculation, not a defensive investment.
Benjamin Franklin Lens
The Franklin frame, applied through modern thrift and opportunity cost, asks whether capital is being spent with discipline. Free-cash-flow generation of $206.3 million on a trailing basis against $86.3 million of first-half capex is a healthy reinvestment ratio, with the company guiding to roughly $210 million for full-year fiscal 2026, which means management is committing about 1.05x trailing FCF to growth and maintenance, leaving little excess for discretionary return. Dividends paid of $29.9 million in the first half and a quarterly $0.30 per share payout plus modest repurchases at a premium to historical prices (around $58.18 to $63.80 per share during the quarter) reflect measured shareholder return rather than profligate cash deployment. Opportunity cost at the dated price is the more pressing Franklin question: dollars deployed here may earn less than alternative investments given the implied growth embedded in the equity.
Warren Buffett Lens
Buffett would focus on durable owner economics and capital-allocation integrity. Free cash flow of $206.3 million is a partial owner-earnings proxy because the filings do not separate maintenance from growth capex; on a normalized 1.5x of trailing operating cash flow, the implied owner earnings cluster in the $130 to $150 million range, well below the dated equity value's implied earnings stream at the available long-run growth rates. Capital allocation is shareholder-friendly on its face (buybacks at an average $58.18 to $63.80 versus a $116.59 dated price, roughly half-priced historically), and the convertible-debt refinancing path through 2030 reduces near-term refinancing risk. However, the dated market capitalization of $5.80 billion sits in the bull band of the available scenarios, so Buffett's margin-of-safety bar would not be cleared on visible evidence.
Charlie Munger Lens
Munger would emphasize incentive alignment, inversion, and bias checks. Founder/CEO ownership with deep tenure (David Overton has been Chairman and CEO throughout) is a positive structural signal. However, a $0.30 per-quarter dividend declared against a stock trading near $116 yields roughly 1.0%, insufficient as a return-anchor; capital gains on a multiple of free cash flow are the principal expected return. Inversion: if same-store sales were flat for two years, the available base case would not be achieved and the price would need to re-rate; the dated market capitalization alone pays for a steady-state FCF of $206.3 million at a multiple of roughly 28x, which seems thin against cyclical discretionary-spending risk. Bias: it is easy to over-index on a founder-led brand's apparent quality, ignoring that the equity price already absorbs much of that quality. Munger would likely pass.
Li Lu Lens
Li Lu would apply the circle-of-competence filter: a four-brand U.S. casual-dining portfolio with internal bakery production, a 368-restaurant estate, and roughly $3.9 billion of trailing-twelve-month revenue is a compact, durable, regulatorily benign business. The culture evidence is positive: founder remains in the chair, capital is returned consistently via dividends and buybacks, share count is down materially, and disclosed executive-officer certifications indicate functioning internal controls. The Li Lu test for permanent loss is whether the brand or operating model could be structurally impaired; the four-concept approach reduces that risk and the bakery operation provides an additional supply-and-margin cushion. What the Li Lu frame rejects at the dated entry point is paying a price that already reflects durability, because durable does not equal undervalued, and the dated price is in the bull band of the available deterministic scenarios.
Risks, Disconfirming Evidence, and What Would Prove This Thesis Wrong
The most plausible thesis-breakers are observable. First, a same-store sales contraction at The Cheesecake Factory brand (the largest concept footprint) would break the supply-side leverage embedded in the valuation model; the filings specifically warn of comparable-restaurant-sales risk. Second, a return of wage or food inflation would compress the operating margin from the reported 7.6% in the quarter to a level inconsistent with the growth assumptions in the bull and base scenarios; the risk-factor section explicitly names wage inflation as a historical pressure. Third, North Italia, Flower Child, or Other FRC concept underperformance (the FRC acquisition is the source of $13.2 million of first-half contingent-consideration payments) would invalidate the multi-concept compounding story on which the dated price depends.
Disconfirming evidence: the dated market capitalization absorbs a free-cash-flow growth path that the available reverse-DCF math implies is well into double digits; if year-over-year revenue growth at the 7.7% second-quarter pace decelerates and free-cash-flow conversion drops, the implied balance erodes. Workforce and commodity shocks, a consumer-discretionary pullback, or a debt covenant breach under the Revolver Facility would each be observable thesis-breakers; the loan agreement's Net Adjusted Leverage Ratio of 4.25x is the binding day-to-day control, and the dated lease portfolio is materially larger than funded debt. The educational moral is that quality and price are independent variables; one can respect a brand without financing it at the dated entry point.
Investment Conclusion
Cheesecake Factory is a high-quality multi-concept restaurant operator with a multi-decade operating record, modest funded leverage, and consistent return of capital. Its operating margin reached roughly 7.6% on $1.03 billion of second-quarter revenue, with trailing-twelve-month free-cash-flow of $206.3 million. The dated price of $116.59 implies a market capitalization of $5.80 billion, which sits well above the available base-scenario fair value range and is consistent only with the bull scenario's growth and discount assumptions. With the dated equity essentially paying for durability already reflected in base earnings and showing minimal margin of safety against the available normalized cash flow, the entry point is Overvalued.
This article is for educational and informational purposes only and does not constitute investment advice. Past performance is no guarantee of future results, and forward-looking statements involve risk and uncertainty.
Share this article