The investment case — and what could go wrong
- Cost of goods sold rose to $43,396,809 from $42,488,910, so gross margin expanded to about 23.6% from 22.6%, a modest but real improvement that drove gross profit to $13,377,832.
- Pricing power appears modest in the consumer segment, where the company explicitly flags the risk of being unable to raise retail prices to reflect commodity-cost changes.
- Where the issuer reports cash flow and capital expenditure cumulatively, the standalone-quarter cash-flow figures are derived by subtracting the preceding cumulative filing.
Selected from this article · 2026-10-13
Read on for the full pictureThe Quarter in Context
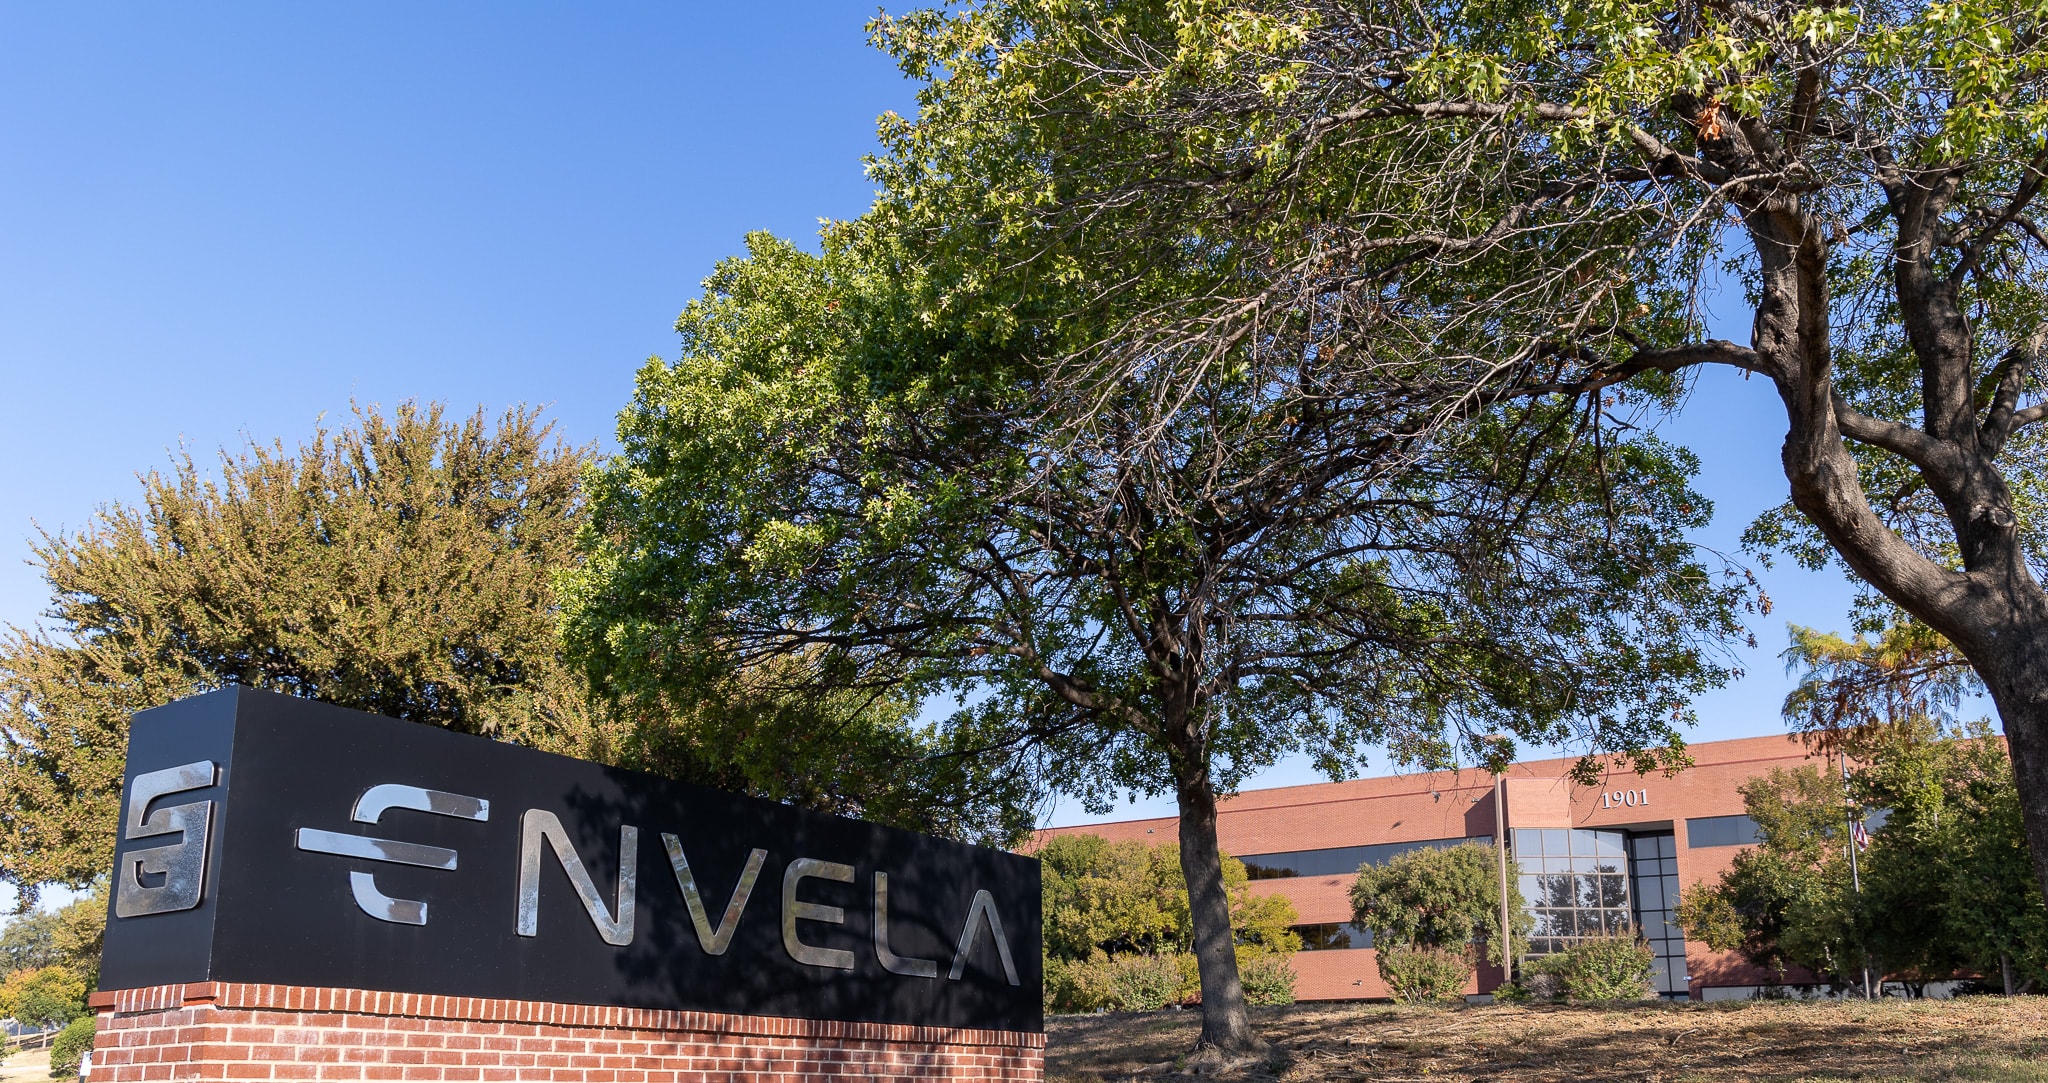
For the three months ended June 30, 2026, Envela reported sales of $56,774,641 against $54,876,833 a year earlier, a roughly 3.5% gain. Cost of goods sold rose to $43,396,809 from $42,488,910, so gross margin expanded to about 23.6% from 22.6%, a modest but real improvement that drove gross profit to $13,377,832. Selling, general and administrative expense fell to $7,778,113 from $8,672,067, which was the swing factor on the income statement: operating income reached $5,102,456 versus $3,255,445, net income $4,174,186 versus $2,752,399, and diluted EPS $0.16 versus $0.11.
The two interpretive cautions both relate to cash. First, the six months ended June 30, 2026 produced operating cash flow of $27,073,602 versus $3,722,594 in the prior year, but management attributes most of the gap to the conversion of an outstanding consumer-segment refining receivable and an inventory drawdown that the company does not expect to recur. Second, the trailing-twelve-month operating cash flow is $25,931,802 and trailing-four-quarter free cash flow is about $24,032,132, a steadier run-rate figure closer to a normalized earning-power number, with capital expenditure still small at about $1,899,670 over the same window. Reading the quarter this way, the headline earnings strength is real but flattered by transient working-capital release.
Business Model and Profit Engine
Envela reports two segments. The consumer segment buys and sells authenticated pre-owned fine jewelry, diamonds, gemstones, luxury watches, and secondary-market bullion, with recycled diamonds set into new designs; the commercial segment de-manufactures end-of-life electronics to reclaim metals and plastics, provides IT asset disposition ("ITAD") services, and handles product returns on a Scope-of-Work basis. Customers in the consumer channel are end consumers shopping retail or wholesale plus business partners sourcing inventory; customers in the commercial channel are largely enterprise counterparties that need assets or materials processed or remarketed. Revenue is recognized at delivery, at assay completion, or upon SOW completion depending on the transaction type, with an embedded estimate of variable consideration for refining later trued up.
Mechanically, the model is an inventory-turn business. For the trailing four quarters, consolidated cost of goods sold less shipping ran about $225,807,302 against average inventory of roughly $28,601,454, implying a consolidated inventory turnover near 7.9x, with the consumer segment at about 7.97x and the commercial segment at about 7.06x. That means the cost of acquiring, curating, and disposing of inventory is the principal variable expense, and gross margin is the principal lever. Consumer segment turnover improved from about 5.98x a year ago and commercial from 6.73x, so operating leverage in both halves of the company comes from moving existing inventory faster rather than from heavy fixed-cost absorption. The principal revenue engines are therefore the consumer jewelry-and-bullion channel and the commercial refining/ITAD channel, both exposed to spot prices for precious and base metals, and both requiring authentication, regulatory compliance, and counterparty screening. Revenue becomes gross profit via cost of goods sold (the dominant variable cost), becomes operating profit through SG&A and depreciation, and becomes cash via the timing of receivables, inventory, and payables where working capital was the principal swing factor in the first half of 2026.
Customer concentration is a meaningful qualitative flag. For the six months ended June 30, 2026, two customers together represented about 50.8% of consolidated sales, almost identical to the 50.3% disclosed a year earlier. The company states it believes no single customer is critical because of its diverse outlets, but two customers delivering over half of sales is a real concentration that has not yet meaningfully diversified. Pricing power appears modest in the consumer segment, where the company explicitly flags the risk of being unable to raise retail prices to reflect commodity-cost changes. Capital intensity is low: total capital expenditure of $1,530,683 over the first six months of 2026 and about $1,899,670 over the trailing four quarters is small relative to revenue and operating cash flow, and management describes the bulk as maintenance improvements to the corporate head office and a new store build-out, characterized as maintenance in the company's own liquidity narrative. Working capital is the swing factor in cash conversion: an $8 million refining receivable collection and a $5.2 million consumer inventory reduction available the bulk of the first-half cash-flow benefit.
A few observable conditions would weaken the profit engine. A reversion of consumer-segment inventory turnover back toward the 6x range would compress margin, a sustained drop in precious-metal spot prices would compress the refining top line, and any failure of the company to renew or replace $7.6 million of short-term notes payable as it matures would constrain growth. Segment-level revenue mix and gross margin breakdowns for the latest quarter are not disclosed in the cited excerpts and remain a data gap. Operating-lease liabilities are present and modestly material at about $9.7 million total, but the company states it funds operations primarily from operating cash flow and is not drawn on its line of credit.
Earnings Quality and Cash Conversion
Where the issuer reports cash flow and capital expenditure cumulatively, the standalone-quarter cash-flow figures are derived by subtracting the preceding cumulative filing. They are calculations from SEC facts rather than separately reported quarterly line items. Where the issuer reports cash flow cumulatively, the standalone-quarter cash-flow figures cited elsewhere in this article are calculated by subtracting the preceding cumulative filing; they are derived from reported SEC facts rather than separately reported quarterly line items. GAAP operating income of $5,102,456 for Q2 2026 was supported by a lower SG&A load, not by unusually large one-time gains, so the income statement is reasonably clean by that standard. The four-quarter cumulative EPS of about $0.74 is a derived figure: it sums the 2025 Q3 quarterly EPS ($0.13), the 2025 Q2 quarterly EPS ($0.11), the 2026 Q1 quarterly EPS ($0.34), and the 2026 Q2 quarterly EPS ($0.16), and any use of that denominator should treat it as an arithmetic aggregation across the four most recent standalone quarters rather than a true reported trailing-twelve-month line. Stock-based compensation is reported as zero across the periods available; this is treated here as a data-presentation observation rather than a confirmed earnings-quality finding, because the standardized XBRL concept available may not capture amounts disclosed elsewhere in the filing. Diluted weighted-average shares are essentially flat at 25,963,476 across the four most recent periods, so there is no visible dilution drag in the income statement, though absence of a captured SBC line item does not by itself certify there is no dilution of any kind.
The unusual gap between reported net income and operating cash flow in the first half is reconciled in the cash-flow statement as the conversion of a consumer-segment refining receivable (an $7,992,472 working-capital benefit) and an inventory reduction of $5,244,241, together with a $2,631,849 increase in accrued expenses mostly for income taxes. These movements are corroborated by management's own narrative that the increase was largely non-recurring. For the trailing four quarters, operating cash flow of $25,931,802 and free cash flow of $24,032,132 are closer to a normalized run-rate, and inventory turns improved, so earnings quality looks acceptable on a cash basis, with the working-capital flag the main caveat. The accounting free-cash-flow proxy used here is operating cash flow minus total capital expenditure; the filings do not separately disclose maintenance versus growth capital expenditure, so this should be read as an accounting proxy rather than a true maintenance-capex owner-earnings figure. The balance sheet at June 30, 2026 shows $43,441,856 of cash and cash equivalents (up from $18,154,849 at year-end 2025), $29,821,724 of inventory, $3,197,115 of accounts receivable, and total debt of $9,668,723 (current notes payable $7,589,297 plus non-current notes payable $2,079,426). A current-quarter net-cash figure is unavailable because the package does not include a same-date net-cash adjustment, and the older cash snapshot from the available SEC data package was excluded; that limitation is acknowledged rather than bridged here.
Business Quality, Moat, and Industry Position
On the available evidence, Envela is best described as an important participant in a recommerce and recycling market, not a demonstrated core supply-chain bottleneck; that classification describes strategic position only and is not independent proof of a moat or valuation upside. The durable advantage the company leans on is sourcing: it explicitly relies on a network of business partners who supply inventory on consignment or outright, which is a barrier to entry in the sense that relationships, compliance infrastructure, and trust take time to build. This is a sourcing-and-distribution advantage, not a technology or brand moat. The risk factors list highlights counterfeit products, lab-grown diamonds, shifting consumer preferences, seasonality, AML compliance, and intense competition across both segments, all of which constrain the durability of any pricing-power advantage.
Within jewelry specifically, the company is exposed to a broad set of competitors including traditional retailers and pawn or secondhand channels; the 10-K describes its market as having no dominant incumbent but multiple participants of varying scale. Industry position is best characterized as a focused mid-size specialist rather than a category leader. Within ITAD and product returns, the company's commercial segment competes against larger electronics-recycling firms, and the 10-K acknowledges intense competition across all markets for its products and services. From a supply-chain perspective, the consumer segment is downstream of secondary-market suppliers and consumers; the commercial segment is midstream, taking in used IT equipment and producing refined commodities that go to downstream processors. Envela's principal supplier and customer concentration risks overlap: two customers accounted for over half of consolidated sales in the first half of 2026, which by itself qualifies as a strategic importance observation but does not on the available evidence constitute a classic bottleneck position, and no third-party scuttlebutt evidence has been available to corroborate sourcing moat strength.
Management and Capital Allocation
The same executive team has signed both filings: John R. Loftus as Chairman, Chief Executive Officer, and President, and John G. DeLuca as Chief Financial Officer, Secretary, and Treasurer, with four additional directors on the signature page of the 10-K. Capital allocation in the first half of 2026 was disciplined by absolute standards: the company did no share repurchases in the period, kept dividend policy absent (no dividends are paid, with the available SEC data package flagging no XBRL concept for dividends), drew nothing on its line of credit, and added $25,287,007 of cash to the balance sheet while spending $1,530,683 on capital projects described in the company's liquidity section as maintenance-related improvements to the corporate head office and a new store build-out in the consumer segment, that characterization being the company's own label rather than an author inference. The buyback program allows repurchases at a per-share price not to exceed $9.00; the trailing-twelve-month treasury-stock additions total only $0.19 million, and no shares were repurchased in any month of 2026, indicating management is not currently using buybacks as an active return-of-capital tool, in part because the dated share price is above the program's $9.00 ceiling.
Debt repayments were modest at $255,912 for the half, mostly notes payable maturities that had already been pushed to later in 2025. The capital allocation picture is therefore conservative: build cash, do small capital projects (predominantly maintenance by management's own description), avoid dilution in the observed periods, and do not pay a dividend. There is no large acquisition in flight and no obvious value-destructive behavior to flag. The 10-K also discloses that voting power is substantially controlled by a small number of shareholders, which the filing notes could make a takeover or removal of incumbent directors more difficult even when shareholders consider such changes beneficial; that observation is presented as a governance disclosure rather than an author judgment on desirability.
Valuation and What the Market Already Expects
As of October 13, 2026, the dated market capitalization was $310,523,173 against a last sale price of $11.96, on roughly 25,963,476 shares outstanding per the June 30, 2026 balance sheet. The trailing-four-quarter free cash flow of approximately $24.0 million against a $310.5 million equity value implies a free-cash-flow yield of roughly 7.7% before any adjustment for working-capital normalization, with observed year-over-year revenue growth of about 3.5% in the latest quarter. The qualitative read on the dated price is that the market is paying for steady execution in the consumer segment, modest operating leverage, and a working-capital release that lifted trailing cash flow above the underlying run rate. Because the same-date balance-sheet adjustment was not available, no net-cash bridge to enterprise value is reproduced here; this is a limitation rather than a guess.
Ten-Year Cash Flow to Fair Market Value
The starting free cash flow is the normalized SEC cash-flow proxy, while every growth rate, discount rate and terminal rate below is an explicit editorial assumption rather than company guidance. Each annual cash flow is forecast and discounted separately; terminal value is year-ten free cash flow multiplied by one plus terminal growth, divided by discount rate minus terminal growth, and then discounted back ten years. Fair market capitalization equals that explicit ten-year present value plus discounted terminal value and a same-date balance-sheet adjustment when available. If current cash and debt facts do not share one report date, the table shows the adjustment as unavailable and conservatively applies zero. The share count is derived from the dated market capitalization and share price so US shares and foreign ADRs use a consistent traded-security denominator.
Year | Bear FCF | Base FCF | Bull FCF |
|---|---|---|---|
1 | $23.6M | $25M | $26.4M |
2 | $23.1M | $26M | $29.1M |
3 | $22.6M | $27M | $32M |
4 | $22.2M | $28.1M | $35.2M |
5 | $21.7M | $29.2M | $38.7M |
6 | $22M | $30.1M | $40.6M |
7 | $22.3M | $31M | $42.7M |
8 | $22.6M | $31.9M | $44.8M |
9 | $22.9M | $32.9M | $47M |
10 | $23.2M | $33.9M | $49.4M |
Scenario | Growth years 1–5 / 6–10 | Discount | Terminal | 10-year PV | Terminal PV | Balance-sheet adjustment | Fair market cap | Fair value/share | Margin of safety | Terminal share |
|---|---|---|---|---|---|---|---|---|---|---|
Bear | -2.0% / 1.3% | 11.0% | 2.0% | $133M | $92.6M | N/A (treated as $0) | $226M | $8.71 | -37.4% | 41.0% |
Base | 4.0% / 3.0% | 9.0% | 3.0% | $185M | $246M | N/A (treated as $0) | $431M | $16.6 | 27.9% | 57.1% |
Bull | 10.0% / 5.0% | 8.5% | 3.5% | $242M | $452M | N/A (treated as $0) | $694M | $26.7 | 55.3% | 65.1% |
In the reverse-DCF, holding the 9% discount rate and 3% terminal growth fixed, and solving only for one constant growth rate rather than using the base-case growth path, the current market capitalization implies roughly -0.7% annual free cash flow growth for ten years. This is a sensitivity framework, not a price target: the terminal-value share shows how strongly each result depends on assumptions beyond the explicit forecast. Negative margin of safety means the current market capitalization exceeds the scenario value.
Five Value-Investing Lenses
Benjamin Graham Lens
The balance sheet is the main support here. As of June 30, 2026, stockholders' equity was $80,074,127 against total liabilities of $27,929,034, with goodwill of $3,621,453 and intangibles of $3,033,499, so tangible book value is approximately $73,419,175. With a $310,523,173 market capitalization, the price-to-tangible-book-value ratio is meaningfully above the level Graham typically required for a margin of safety, and on the article's own quantitative screen the Graham floor is failed. Net current asset value is comfortably positive because current assets of $77,577,055 far exceed current liabilities of $18,294,075. Graham would also look at the absence of a dividend and the small buyback activity and might conclude that management is reinvesting internally rather than returning cash, which is acceptable when the underlying business earns well above its cost of capital; given the working-capital flag and the narrow sourcing moat discussed elsewhere, that condition is not self-evidently satisfied here.
Benjamin Franklin Lens
Franklin's modern application here is about thrift, discipline, and opportunity cost. Envela runs a low-capex model with capital expenditure of only about $1,899,670 trailing four quarters and a balance sheet that generated $25,931,802 of operating cash flow over the same window. The discipline shows in the absence of debt issuance, no observed share repurchases in 2026, and the small share count at 25,963,476 outstanding that has barely moved year over year. The opportunity-cost question is what else the $310.5 million of equity value could earn, and on a free-cash-flow yield of roughly 7.7% before any normalization adjustment, the dated yield is reasonable but not a clear bargain compared with high-quality alternatives whose cash-flow durability does not depend on commodities, customer concentration, or working-capital releases.
Warren Buffett Lens
An owner-earnings proxy can be approximated by taking trailing-four-quarter operating cash flow of $25,931,802 and subtracting the same window of capital expenditure of $1,899,670, which yields about $24,032,132 of accounting free cash flow; this is a proxy because the filings do not separate maintenance from growth capital expenditure, and the management section does confirm the bulk of 2026 spending was maintenance head office work and a new store build-out. With a $310,523,173 market capitalization, the dated price is consistent with a free-cash-flow multiple of roughly 13x, which is not obviously low for a small-cap consumer discretionary business. Buffett would also focus on the moat question: the company's principal advantage is sourcing relationships and recommerce infrastructure, which is real but narrow, and the customer concentration (two customers at 50.8% of sales) would be a flag against a true wide-moat label. On that moat-and-owner-earnings basis the dated price does not clear a moat-supported margin of safety.
Charlie Munger Lens
Munger would invert the question: how does Envela permanently lose money? The most plausible paths are (1) a sustained drop in precious-metal spot prices that compresses refining revenue, (2) a consumer shift away from natural diamonds toward lab-grown alternatives that hurts the consumer segment's premium pricing, (3) a regulatory or AML-compliance failure that disrupts the sourcing network, and (4) an inability to renew or replace maturing notes payable that constrains growth. Munger would also flag incentives: management's incentives appear tied to operating performance and long-tenured ownership of position rather than to a meaningful equity-compensation plan in the observed periods, which neither proves nor disproves shareholder alignment because the proxy disclosures are not in the cited excerpts. The bias check is whether the first-half operating cash flow should be annualized as a steady-state run rate, and the company explicitly states it should not.
Li Lu Lens
The circle-of-competence test for Envela is partly passed and partly not. The business model is reasonably understandable as a sourcing-and-distribution operator in secondary-market jewelry and in IT asset disposition, with clear unit economics in inventory turnover and gross margin. The harder part is whether the consumer jewelry business has durable brand equity beyond its current network or whether it is a flow business dependent on supplier relationships; the 10-K emphasizes trust, transparency, and authentication rather than a recognizable consumer brand. Culture evidence is limited in the filings, but the management team is small, long-tenured at the named officers, and operates a clean cap structure in the observed periods. The permanent-loss control question is whether the dated price already reflects an optimistic normalization of the 2026 working-capital release; the deterministic calculation suggests the answer is yes, with the Bear scenario producing a per-share value materially below the dated price.
Risks, Disconfirming Evidence, and What Would Prove This Thesis Wrong
Three observable thesis breakers stand out. First, if the consumer-segment inventory turnover were to revert toward 5.98x for several quarters rather than stay near 7.97x, that would be evidence that the working-capital acceleration is not durable and that the underlying cash-flow profile is weaker than the trailing window suggests. Second, if precious-metal spot prices, particularly gold, were to fall materially, the commercial refining revenue line would compress and the gross margin would follow, with two-customer concentration of 50.8% making the impact disproportionate. Third, if the company were unable to renew or replace $7.6 million of short-term notes payable as they mature, growth in either segment could be curtailed, and the company explicitly notes that historical renewal is not a guarantee.
The disconfirming evidence against a positive thesis is the same data already in the filings: customer concentration of two customers at over half of sales, modest revenue growth of about 3.5% in the latest quarter, the company's own statement that the first-half working-capital release is not expected to recur, and the article's own Graham quantitative screen showing the dated $310.5 million market capitalization is meaningfully above the level Graham typically required against a roughly $73.4 million tangible book. A reader who already holds the stock would need a clear reason to add at the dated price, because the Graham floor is failed on its own terms and the moat case is narrow.
Investment Conclusion
The Graham quantitative screen the article itself presented is failed on its own terms: the dated $310.5 million market capitalization is meaningfully above the level Graham typically required for a margin of safety against roughly $73.4 million of tangible book value, and the company-specific moat is sourcing relationships of real but narrow strength rather than a wide-moat franchise. With the trailing free-cash-flow proxy at roughly $24.0 million partly flattered by a working-capital release that the company itself flags as non-recurring, two customers at over half of sales, and a $9.00 buyback ceiling below the dated share price, the dated price does not clear a moat-supported margin of safety on the explicit Graham or Buffett-style discipline applied in the lens section above.
The conclusion is therefore that Envela is not buying at a margin of safety, and a reader should wait for clearer evidence that the consumer-segment inventory-turn improvement is durable, that the working-capital release has normalized out of the run rate, and that the dated price has corrected toward levels supported by the deterministic base-scenario anchor or evidence of customer-base diversification. This is not a sell call on the existing franchise but a pause on adding at the dated price.
Educational-use disclaimer: This article is for educational and informational purposes only and is not investment advice. All figures cited are derived from publicly filed SEC documents and a dated market snapshot; the valuation analysis is a model output, not stated forecasts. Readers should perform their own due diligence before making any investment decision.
Share this article