The investment case — and what could go wrong
- The latest balance sheet is supportive but not debt-light.
- Revenue becomes gross profit through product pricing, manufacturing costs, purchased components, and product mix.
- A conservative cash owner-earnings proxy would therefore recognize stock compensation, acquisitions, working-capital needs, and the uncertainty surrounding maintenance spending.
Selected from this article · 2026-11-04
Read on for the full pictureThe Quarter in Context
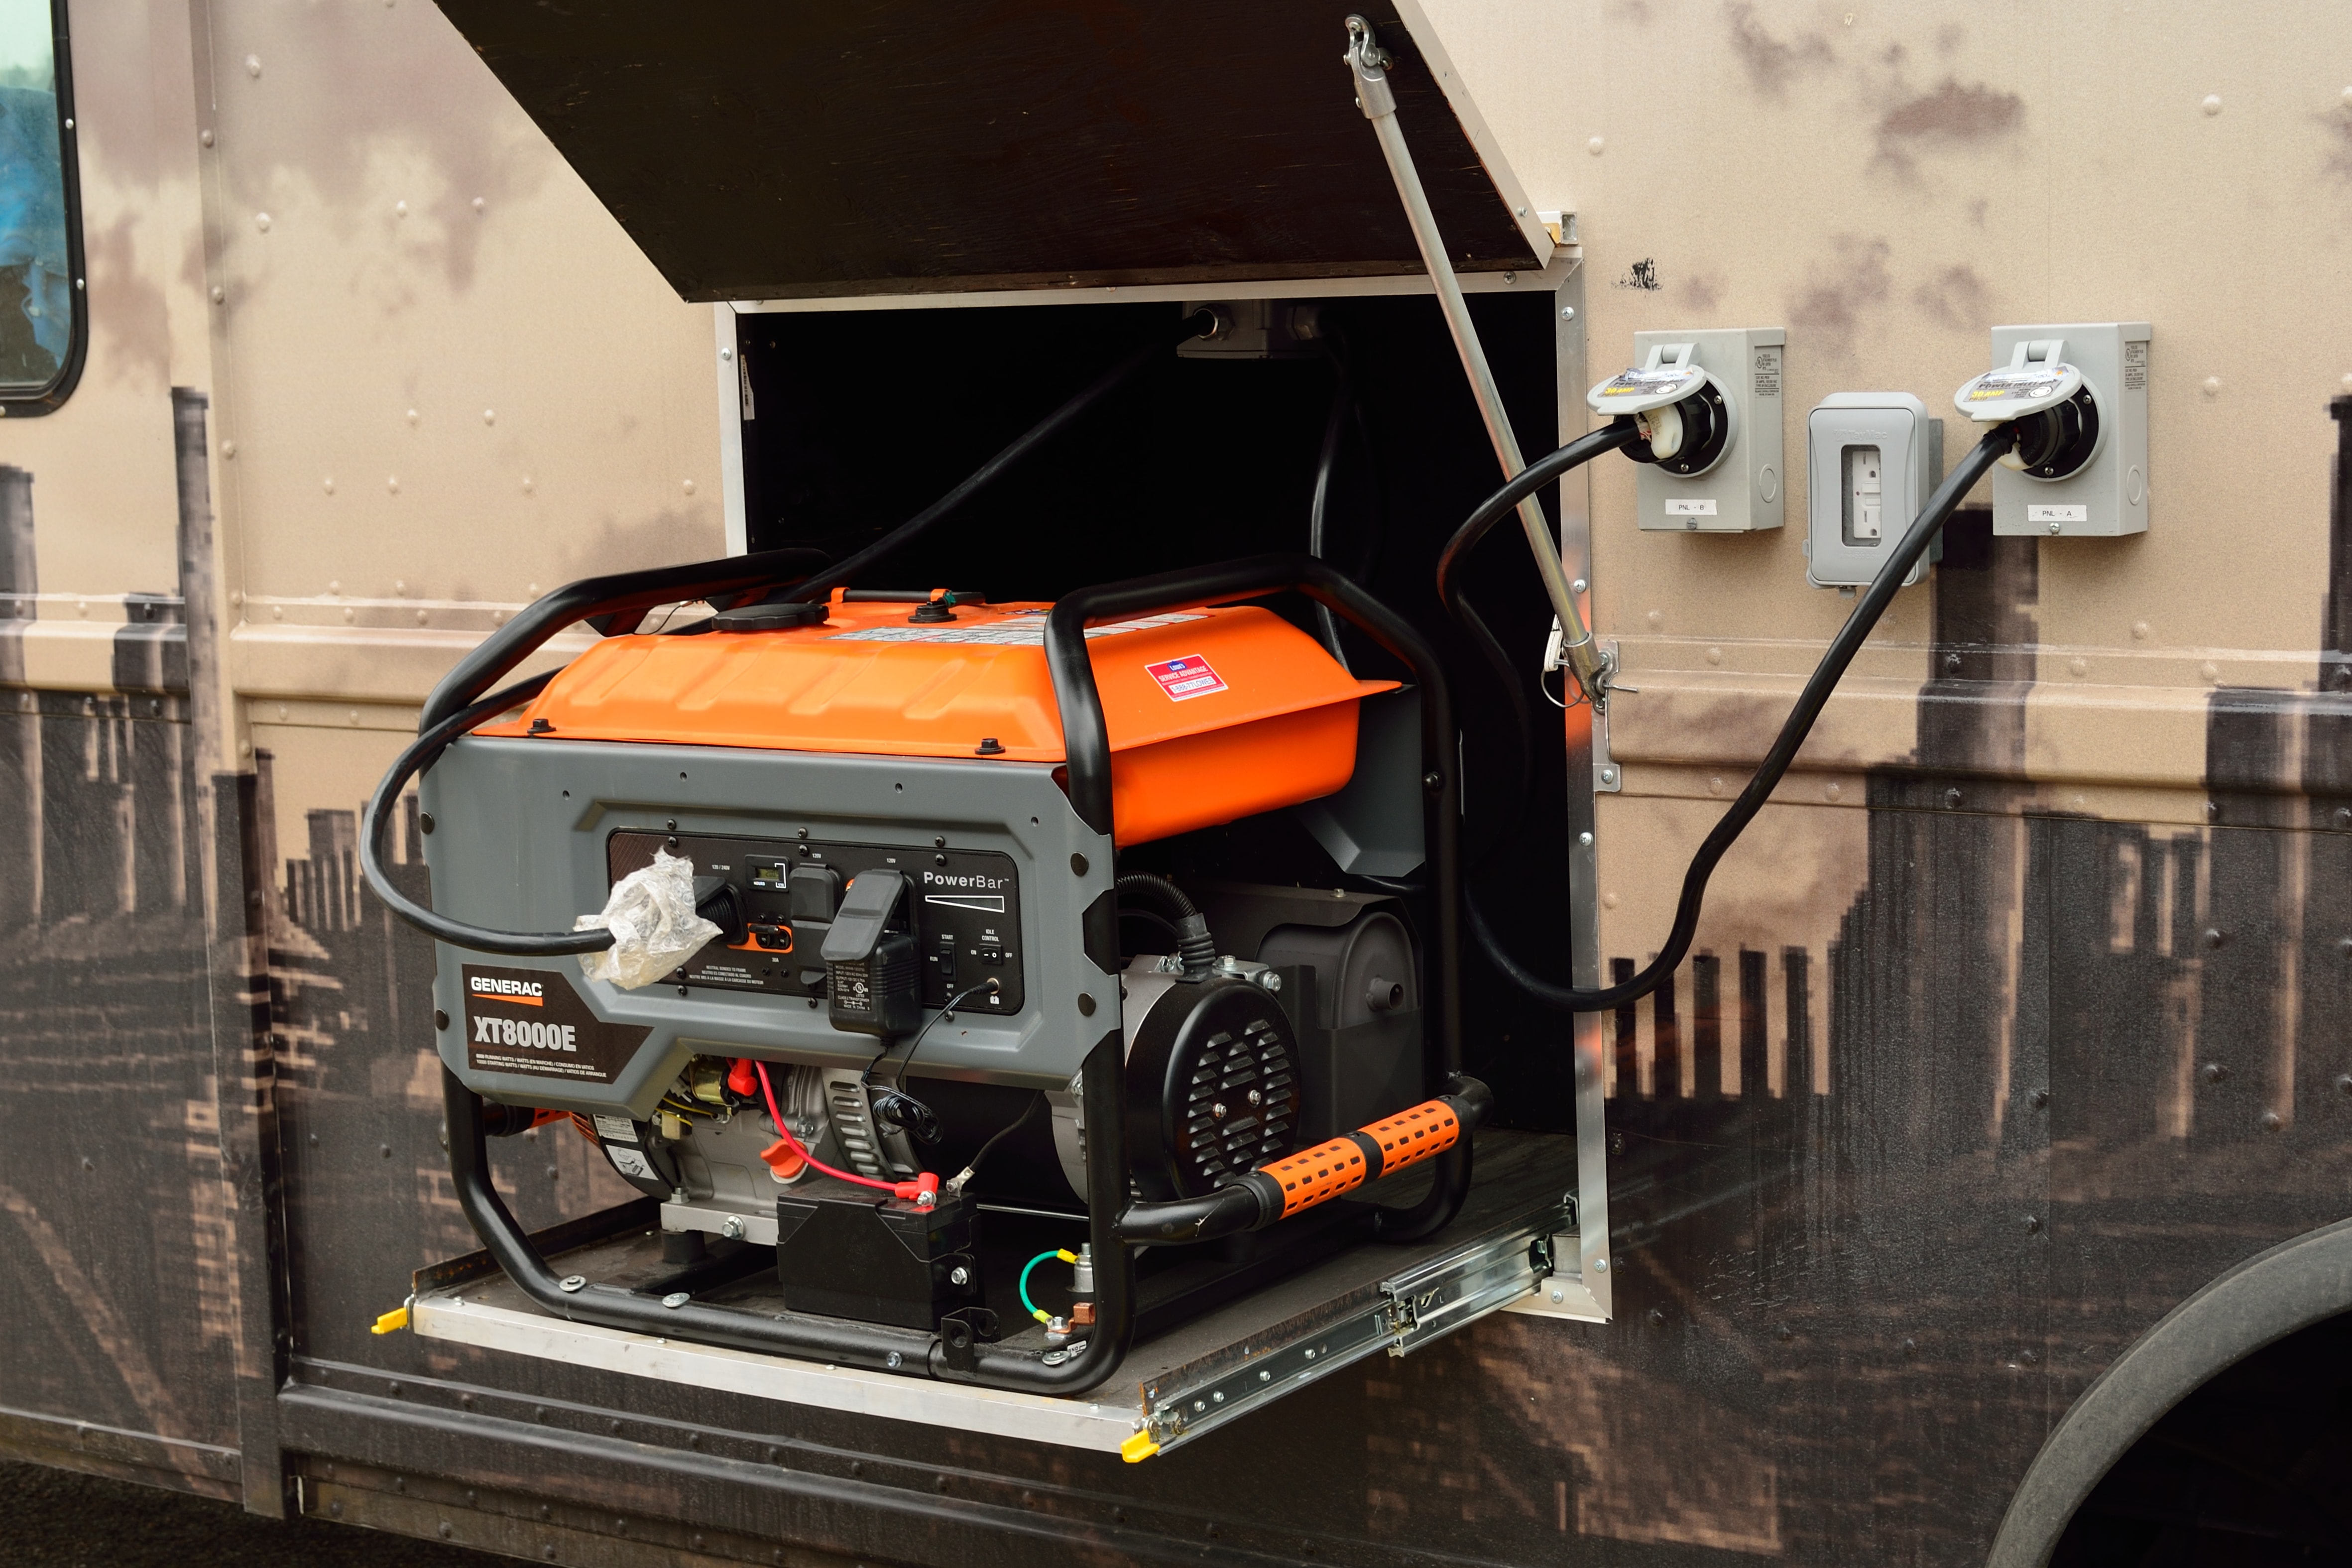
Generac’s third quarter ended September 30, 2026 was strong on the reported operating measures. Net sales were $1.295 billion, up 16.2% from $1.114 billion in Q3 2025. Gross profit was $516.0 million, up 20.9%, and operating income was $160.6 million, up 55.8%. Net income attributable to Generac was $109.2 million, compared with $66.2 million a year earlier; diluted EPS was $1.83 versus $1.12.
The quarter was not uniformly strong. Operating income declined from $210.4 million in Q2 2026 to $160.6 million in Q3, even though sequential sales rose from $1.174 billion to $1.295 billion. That divergence suggests quarter-to-quarter profitability can be sensitive to mix, costs, acquisitions, or other operating factors, although the available excerpts do not identify which factor caused the decline.
The latest balance sheet is supportive but not debt-light. At September 30, 2026, Generac held $393.7 million of cash and equivalents, while the selected current-and-noncurrent borrowing basis totaled $1.269 billion, producing $875.0 million of net debt. Accounts receivable was $846.0 million and inventory was $1.293 billion. These balances make working-capital discipline and debt service central to the equity case.
The market snapshot is dated November 4, 2026 at 2:56 p.m. ET. GNRC closed at $209.28, and the reported market capitalization was $12.349 billion. That is the relevant price against which the quarter, balance sheet, and future cash generation should be judged; a strong quarter does not itself make the shares inexpensive.
Business Model and Profit Engine
Generac designs and manufactures power-generation equipment, energy-storage systems, energy-management controls and solutions, and related power products and services. Its customers include residential, commercial, industrial, rental, telecom, and data-center users. Dealers, distributors, retailers, e-commerce partners, wholesalers, rental companies, and some direct end-user relationships form the sales channels. The value purchased is reliable backup or mobile power, energy resilience, and increasingly integrated management of generation and storage.
The principal economic engines are the established residential and commercial generator franchises, international and industrial equipment, portable and mobile power, and newer energy-technology offerings that include storage, controls, natural-gas systems, and large-megawatt diesel products. Standby equipment is principally a product transaction, although service and maintenance can add later customer relationships. Wolter, acquired in May 2026, adds distribution, maintenance, and repair capability. Allmand and Enercon expand mobile power and high-reliability industrial equipment.
Revenue becomes gross profit through product pricing, manufacturing costs, purchased components, and product mix. In Q3 2026, cost of goods sold was $778.7 million, leaving $516.0 million of gross profit. Selling and service expense was $174.9 million, R&D $63.8 million, G&A $88.1 million, and intangible amortization $28.6 million, yielding $160.6 million of operating income.
Operating leverage is plausible because the company supports multiple product lines through a shared commercial and administrative infrastructure. However, the filings available here do not provide product-level contribution margins, unit economics, fixed-versus-variable cost splits, or segment profitability. It would therefore be speculation to attribute the gross-margin improvement to pricing, acquisitions, or scale individually. A 39.9% gross margin and 12.4% operating margin in Q3 are facts; their durability is an inference that requires more evidence.
Working capital is substantial. Receivables and inventory together were $2.139 billion at September 30, 2026, nearly equal to quarterly sales. Demand forecasting, dealer inventory, raw-material availability, and factory capacity therefore matter. The filing also identifies reliance on a small number of contract manufacturers and component suppliers, including single-source suppliers.
Capital intensity is meaningful. Nine-month 2026 property and equipment spending was $126.9 million, but the filing does not split maintenance from growth spending, so it would be unsafe to call all of it maintenance capital expenditure. Conditions that would weaken the profit engine include sustained gross-margin compression, inventory rising without corresponding sales, dealer destocking, supply disruption, or capacity spending that fails to produce utilization.
Earnings Quality and Cash Conversion
Quarterly cash-flow calculations below subtract two reported cumulative statements. These are author calculations, not directly reported quarterly line items. Amounts are USD.
Metric | Quarter | Cumulative less preceding cumulative | Calculated quarter | Sources |
|---|---|---|---|---|
Operating cash flow | 2026-07-01 to 2026-09-30 | $411,485,000 (2026-09-30) minus ($240,496,000; 2026-06-30) | $170,989,000 | Statements through 2026-09-30 and 2026-06-30 |
Operating cash flow | 2025-07-01 to 2025-09-30 | $248,719,000 (2025-09-30) minus ($130,341,000; 2025-06-30) | $118,378,000 | Statements through 2025-09-30 and 2025-06-30 |
Capital expenditure | 2026-07-01 to 2026-09-30 | $126,937,000 (2026-09-30) minus ($87,687,000; 2026-06-30) | $39,250,000 | Statements through 2026-09-30 and 2026-06-30 |
Where the issuer reports cash flow and capital expenditure cumulatively, the standalone-quarter cash-flow figures are derived by subtracting the preceding cumulative filing. They are calculations from SEC facts rather than separately reported quarterly line items.
Cash generation strengthened. Q3 2026 operating cash flow was $170.989 million, calculated by subtracting the $240.496 million reported for January through June 2026 from the $411.485 million reported for January through September 2026. The comparable Q3 2025 calculation was $118.378 million. Q3 capital expenditure of $39.250 million was likewise derived from the nine-month 2026 amount of $126.937 million less the six-month amount of $87.687 million.
Those calculations produce a Q3 2026 accounting free-cash-flow proxy of $131.739 million: operating cash flow minus total property and equipment spending. On a trailing-twelve-month basis, the same proxy was $414.491 million, based on $600.744 million of operating cash flow and $186.253 million of capital expenditure. This is a cash-flow proxy, not normalized sustainable earnings or “maintenance-capex owner earnings,” because maintenance and growth spending are not separated.
Cash conversion was strong in the quarter, but working capital explains much of the nine-month change. Net income for January through September 2026 was $325.1 million, while operating cash flow was $411.5 million. Accounts receivable used $241.7 million of cash and inventories used $40.2 million, partly offset by a $192.1 million increase in accounts payable. Those are cash movements, not additional earnings.
One reported item also affects comparability. Generac received approximately $91.1 million of Phase I tariff refunds in the first nine months of 2026, including $9.5 million recorded as a reduction of cost of goods sold in Q3. All expected Phase I refunds had been received by September 30, 2026, so this benefit should not be extrapolated.
Stock-based compensation was $13.042 million in Q3 and $51.325 million on a trailing-twelve-month basis. It is noncash in the period but represents an economic cost through dilution. A conservative cash owner-earnings proxy would therefore recognize stock compensation, acquisitions, working-capital needs, and the uncertainty surrounding maintenance spending. The available accounting FCF proxy does not make those adjustments, so it should not be treated as owner earnings without adjustment.
Business Quality, Moat, and Industry Position
Generac’s most credible advantage is the combination of a long-standing generator brand, broad residential and commercial distribution, engineering capability, and a product portfolio that can be integrated across generation, storage, and controls. The company reports a leading North American power-equipment position, while also noting reliance on its dealer network and the importance of new-product acceptance.
The strategic position is important because customers buy resilience: backup generation for outages, mobile power for rental and industrial uses, and increasingly integrated systems for data centers and decentralized energy. Generac participates upstream in engineered equipment and manufacturing, then sells downstream through a multi-channel network to end users and rental fleets. Its direct customers vary by channel, but final demand ultimately comes from homeowners, businesses, industrial operators, telecom users, rental companies, and data-center infrastructure.
The available evidence does not support a reproducible numerical supply-chain bottleneck score or establish Generac as an important bottleneck participant; its significance as a participant is not established by the available filings evidence. Generac can be an important participant where large-megawatt capacity, product qualification, engineering, and dealer support matter, particularly in supply-constrained data-center applications. But the evidence does not show that Generac controls an indispensable upstream resource, faces prohibitive qualification barriers across its portfolio, has superior order visibility, or captures outsized economics from supply scarcity. Capital and components remain important bottlenecks, especially where suppliers are concentrated or single-source.
Evidence for durability is therefore mixed. A broad product set, established channels, and R&D spending of $63.8 million in Q3 2026 support the view that the company can extend its franchise. Yet customer cohorts, segment margins, dealer inventory, service economics, product-level R&D returns, and independent customer or competitor evidence are not available. Those gaps limit confidence in any claim that recent pricing or margins are durable.
Management and Capital Allocation
Management used cash for acquisitions rather than shareholder distributions during the first nine months of 2026. Cash paid for businesses, net of cash acquired, was $211.7 million, while common-stock repurchases and common dividends were both zero. The company also invested $126.9 million in property and equipment.
The acquisitions can deepen product capability and distribution, but the economic test is whether acquired earnings exceed the cost of capital after integration. Goodwill increased to $1.649 billion at September 30, 2026 from $1.467 billion at December 31, 2025, so acquisition integration and impairment risk are material. No segment contribution or acquisition return-on-capital evidence is available here.
Capital structure is another test. Total debt on the selected current-and-noncurrent basis was $1.269 billion, versus $393.7 million of cash. The filing also identifies floating-rate exposure on term loans and the revolving facility and uses swaps to reduce borrowing-cost volatility; hedge notional coverage should not be confused with the duration of the underlying debt.
The incentive structure is observable but should not be confused with cultural quality. Management uses Adjusted EBITDA for planning, budgeting, board review, and as a target for part of senior executive compensation. The filing itself warns that Adjusted EBITDA excludes capital expenditure, working capital, interest, and replacement requirements, while allowing judgment in adjustments. This can encourage near-term focus, but investors should judge results primarily on GAAP earnings, cash flow, and per-share value.
Valuation and What the Market Already Expects
At the November 4, 2026 market capitalization of $12.349 billion, the market was capitalizing Generac far above its trailing accounting FCF proxy of $414.5 million. The resulting accounting FCF-proxy yield was approximately 3.4%, not a normalized or mid-cycle cash yield, because $414.5 million is trailing operating cash flow less total capital expenditure; it may also reflect favorable cycle conditions, acquisitions, tariff recoveries, or working-capital timing.
The burden is not merely that the current price is high. For a cyclical, capital-intensive manufacturer, investors need confidence that revenue growth, margins, utilization, and reinvestment can persist long enough to support a large terminal value. The reverse-DCF calculation indicates that the dated market capitalization requires an operating trajectory far beyond simply extrapolating modest recent growth. This is a model implication, not management guidance.
The price also leaves little protection against execution errors. Generac carries net debt, material working capital, acquisition integration risk, and sensitivity to tariffs, inventory, supplier availability, and product mix. The stock can still work for an investor if the bullish operating path proves correct, but the dated valuation does not provide a Graham-style margin of safety.
Ten-Year Cash Flow to Fair Market Value
The starting free cash flow is reported operating cash flow less reported total capital expenditure: an accounting cash-flow proxy, not normalized sustainable earnings or maintenance-capex owner earnings. Every growth rate, discount rate and terminal rate below is an explicit editorial assumption rather than company guidance. Each annual cash flow is forecast and discounted separately; terminal value is year-ten free cash flow multiplied by one plus terminal growth, divided by discount rate minus terminal growth, and then discounted back ten years. Fair market capitalization equals that explicit ten-year present value plus discounted terminal value and the supplied same-date balance-sheet adjustment. The supplied current cash and debt inputs reconcile to the dated adjustment shown below. Missing inputs are never treated as zero; an unavailable bridge would block this calculation. The share count is derived from the dated market capitalization and share price so US shares and foreign ADRs use a consistent traded-security denominator.
Year | Bear FCF | Base FCF | Bull FCF |
|---|---|---|---|
1 | $416M | $441M | $466M |
2 | $418M | $470M | $524M |
3 | $420M | $500M | $590M |
4 | $422M | $533M | $663M |
5 | $424M | $567M | $746M |
6 | $434M | $586M | $783M |
7 | $443M | $605M | $823M |
8 | $453M | $624M | $864M |
9 | $462M | $644M | $907M |
10 | $472M | $665M | $952M |
Scenario | Growth years 1–5 / 6–10 | Discount | Terminal | 10-year PV | Terminal PV | Balance-sheet adjustment | Fair market cap | Fair value/share | Margin of safety | Terminal share |
|---|---|---|---|---|---|---|---|---|---|---|
Bear | 0.5% / 2.2% | 11.0% | 2.0% | $2.54B | $1.89B | -$0.875B | $3.55B | $60.2 | -247.7% | 42.6% |
Base | 6.5% / 3.2% | 9.0% | 3.0% | $3.5B | $4.82B | -$0.875B | $7.45B | $126 | -65.7% | 57.9% |
Bull | 12.5% / 5.0% | 8.5% | 3.5% | $4.56B | $8.72B | -$0.875B | $12.4B | $210 | 0.5% | 65.6% |
In the reverse-DCF, holding the 9% discount rate and 3% terminal growth fixed, and solving only for one constant growth rate rather than using the base-case growth path, the current market capitalization implies roughly 11.1% annual free cash flow growth for ten years. This is a sensitivity framework, not a price target: the terminal-value share shows how strongly each result depends on assumptions beyond the explicit forecast. For positive scenario equity values, negative margin of safety means the current market capitalization exceeds the scenario value. For zero or negative scenario equity values, a margin-of-safety percentage is not meaningful; the obligations exhaust the modeled enterprise value.
Five Value-Investing Lenses
Benjamin Graham Lens
The Graham question is whether the balance sheet and earnings can limit permanent capital loss at the purchase price. Generac has positive equity, cash generation, and operating earnings, so it is not obviously speculative. However, $1.269 billion of selected total debt against $393.7 million of cash leaves net debt of $875.0 million, while goodwill and intangibles make tangible downside protection difficult to establish. At $209.28, the stock does not offer a clear asset or earnings-based margin of safety. The company’s quality may be sound, but the price fails the downside discipline test.
Benjamin Franklin Lens
Franklin’s modern lesson is thrift, disciplined compounding, and attention to opportunity cost. Generac’s 2026 spending was directed toward acquisitions and property and equipment, with no common dividends or discretionary repurchases. That can be rational if acquired assets earn attractive returns and capacity is genuinely needed. But investors should compare those uses of cash with repaying debt and repurchasing shares below intrinsic value. The company failed to disclose an acquisition return framework, while cash compensation and dilution continue. Capital discipline is therefore plausible but not yet proven.
Warren Buffett Lens
The owner-earnings question is how much cash an owner can extract while maintaining productive capacity. The $414.5 million trailing FCF proxy is useful, but it is not owner earnings: it includes total capex without separating maintenance from growth, does not deduct stock compensation, and may not represent mid-cycle cash generation. Acquisitions must be included in owner economics when they replace organic reinvestment. Buffett-style analysis therefore remains cautious: Generac has a plausible cash engine and brand, but the market price assumes exceptional future cash generation before those adjustments and cycle risks are fully resolved.
Charlie Munger Lens
Munger’s lens focuses on incentives, inversion, and cognitive bias. Adjusted EBITDA is used in planning and compensation, although management acknowledges its limitations; this creates a risk that bonuses reward adjusted results before replacement capital and working-capital needs are considered. The quarter’s sales, margin, and cash growth could also encourage optimism about data centers, energy storage, and acquisitions. Inversion asks what could fail: tariffs may reverse, inventory may prove excessive, acquisitions may disappoint, or rates may keep capital intensive. The major bias risk is treating strategic adjacency and one strong quarter as proof of durable economics.
Li Lu Lens
Li Lu’s questions are whether the business is understandable, culturally durable, and protected against permanent loss. Generac’s products and channels are understandable, and the company’s history, brand, distribution, and engineering provide plausible durability. However, the circle of competence becomes harder when assessing new data-center, storage, microgrid, and energy-management opportunities without segment economics or external customer validation. Culture appears disciplined in disclosure and capital allocation only in part: effective controls and transparent GAAP results are positives, while acquisition execution and compensation design remain open questions. Permanent-loss protection depends on demand, balance-sheet resilience, and avoiding value-destroying expansion.
Risks, Disconfirming Evidence, and What Would Prove This Thesis Wrong
The most likely wrong assumption is that recent growth and cash conversion represent a durable operating plateau rather than a favorable combination of demand, mix, acquisitions, tariff recovery, and working-capital timing. If that assumption fails, revenue or margins could slow while capital spending remains elevated. The stock would then carry both operating disappointment and multiple compression.
Three observable thesis breakers should be watched. First, gross margin could fall materially from the Q3 2026 level while revenue remains flat or declines, indicating weaker pricing, adverse mix, or cost inflation. Second, inventory could continue rising relative to sales, or receivables could absorb cash, causing operating cash flow to fall below net income. Third, debt could rise relative to cash while acquisitions or capital spending continue, especially if operating income falls.
A fourth falsifier is product-level evidence: a material slowdown in large-megawatt diesel demand, data-center qualification, storage adoption, or dealer sell-through would undermine the growth narrative. Conversely, evidence that could force a more constructive conclusion includes sustained high cash conversion without working-capital release, stable or expanding gross margins through a less favorable cycle, lower net debt, and acquisition returns that exceed the company’s cost of capital.
The opportunity cost is also material: at a low cash-flow yield and high valuation burden, an investor can lose purchasing power by paying today for distant growth that may not arrive. Even if Generac remains a good company, owning it at this price may produce a poor return if alternatives offer better prospective yield with less cyclical risk.
Investment Conclusion
Generac’s Q3 2026 quarter ended September 30, 2026 demonstrated improving demand and cash generation, while operating leverage remains plausible but is not demonstrated by the available filings. The business has credible strengths in backup power, distribution, brand, and an expanding energy-technology portfolio. Yet the dated November 4, 2026 price requires strong sustained cash-flow growth, while the company carries net debt, substantial working capital, acquisition risk, and cyclicality.
The base valuation is materially below the market capitalization, and even the bull case offers only a negligible margin of safety. The appropriate conclusion is Overvalued, not a judgment that Generac is a poor business. A more attractive entry would require either a materially lower price or evidence of stronger mid-cycle cash generation, durable margins, and successful capital deployment.
This article is for educational use only and is not investment, tax, or financial advice. Readers should conduct their own due diligence and consider their objectives, financial circumstances, and risk tolerance.
This article is for research and educational purposes and does not constitute personalized investment advice.
Share this article