The investment case — and what could go wrong
- Revenue was $2.703 billion, up 29.4% from $2.089 billion in the third quarter ended September 30, 2025.
- Inventories therefore represent both a customer-service asset and a risk if production schedules, pricing, or product mix turn unfavorable.
- Where the issuer reports cash flow and capital expenditure cumulatively, the standalone-quarter cash-flow figures are derived by subtracting the preceding cumulative filing.
Selected from this article · 2026-10-30
Read on for the full pictureThe Quarter in Context
Howmet Aerospace’s third quarter ended September 30, 2026 was strong. Revenue was $2.703 billion, up 29.4% from $2.089 billion in the third quarter ended September 30, 2025. Operating income was $777 million, versus $542 million, and net income was $567 million, versus $385 million. Diluted earnings per share increased to $1.42 from $0.95. The filing says approximately 68% of nine-month revenue came from commercial and defense aerospace markets, making the quarter primarily an aerospace execution story rather than a broad industrial recovery.
Growth was uneven beneath that headline. Engine Products sales rose to $1.451 billion from $1.087 billion, and its segment adjusted EBITDA rose to $567 million from $362 million. Fastening Systems benefited from the CAM and Brunner acquisitions as well as aerospace growth, while its adjusted EBITDA margin fell 140 basis points year over year. Engineered Structures sales declined to $295 million from $307 million because of a divestiture and product rationalization, although productivity raised its adjusted EBITDA margin. Forged Wheels benefited from higher commercial-transportation volumes but passed through inflationary costs that compressed margin.
The quarter should therefore be read as a strong period for an expanding, increasingly acquisitive manufacturer, not proof that every segment is compounding smoothly. Management expected 2026 commercial-aerospace, defense-aerospace, and gas-turbine demand to increase, but those are management expectations rather than reported outcomes. The company also expected capital expenditures to remain elevated for capacity expansion.
Business Model and Profit Engine
Who pays? Howmet sells engineered metal components to aircraft and engine manufacturers, aerospace and defense customers, gas-turbine customers, commercial-truck makers, distributors, and other industrial or transportation buyers. These customers buy components whose performance, weight, temperature resistance, reliability, or safety matters. Commercial and defense aerospace customers represented about 68% of nine-month 2026 revenue; gas turbines, commercial transportation, and other markets available the remainder. Products are sold directly or through distributors, so not every transaction has the same recurring or contractual character.
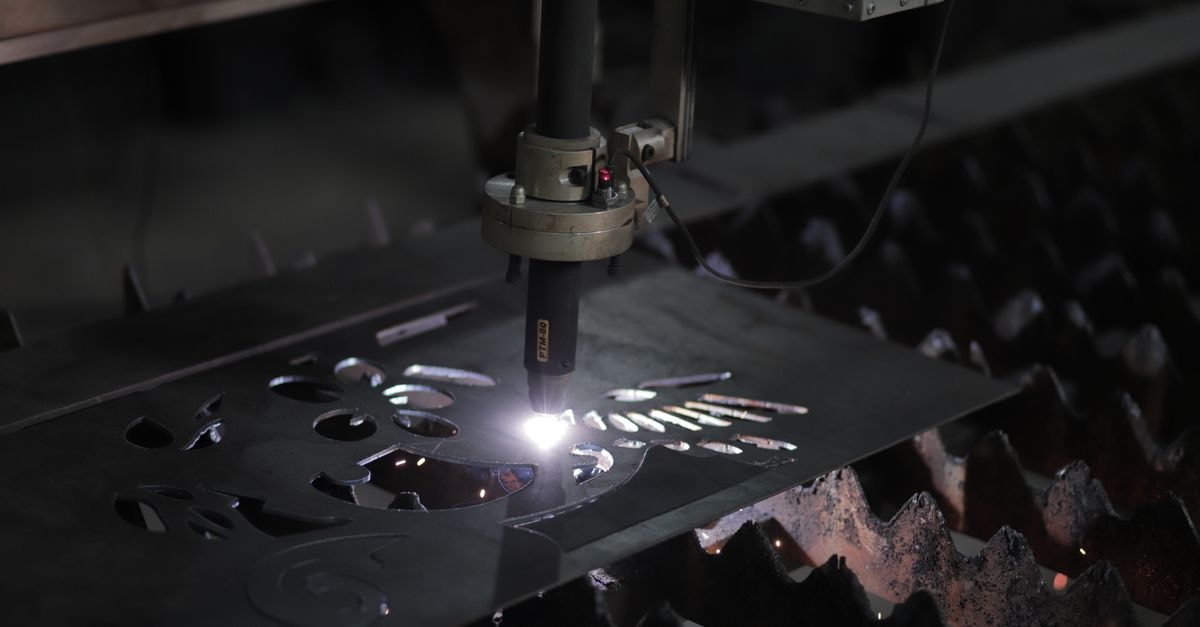
The four operating engines are distinct. Engine Products makes investment castings, airfoils, seamless rolled rings, and rotating and structural parts for aircraft engines and gas turbines. Fastening Systems makes aerospace fasteners and selected industrial, commercial-transportation, and renewable-energy fasteners. Engineered Structures produces titanium ingots and mill products, titanium and aluminum forgings, extrusions, machined components, and assemblies. Forged Wheels makes forged aluminum wheels for heavy-duty trucks and mass transportation. Engine Products was the largest profit engine in the quarter, with $567 million of segment adjusted EBITDA; Fastening Systems, Engineered Structures, and Forged Wheels contributed $185 million, $70 million, and $86 million, respectively.
Economically, revenue first pays for materials and direct manufacturing, then selling, administrative, research and development, depreciation, and restructuring or other charges, leaving operating profit. Variable costs include metal inputs, energy, freight, labor, and production costs that move with volume and pricing. Depreciation, plant capacity, corporate infrastructure, and some acquisition costs are more fixed or semi-fixed, so higher utilization can create operating leverage; the reverse can happen when volumes soften. The Engine Products margin improvement and Engineered Structures productivity gains provide observable operating leverage, while Forged Wheels shows that cost pass-through can protect cash gross profit without preserving percentage margin.
Pricing power appears strongest where customers value certified performance and where Howmet’s material and process expertise is difficult to replace. Forged Wheels can pass through aluminum and other inflation, but with a lag. In July–September 2026, aerospace revenue rose strongly while commercial transportation improved; Engine Products also benefited from gas-turbine demand. The company expects tariff costs to pass through to customers, while explicitly warning that recovery delays can hurt margins. That is evidence of contractual pricing mechanisms, not proof of unrestricted pricing power.
Working capital is material. At September 30, 2026, receivables were $1.116 billion and inventory was $2.113 billion. Growth consumed cash: nine-month operating cash flow included $284 million of receivables use and $117 million of inventory use, partly offset by $68 million of accounts-payable growth. Inventories therefore represent both a customer-service asset and a risk if production schedules, pricing, or product mix turn unfavorable. Segment contribution is disclosed, but full segment gross margins, customer cohorts, and a maintenance-versus-growth capital-expenditure split are not available in the filing excerpts. Observable profit-engine weaknesses would be falling Engine Products margins, inability to recover input inflation, Fastening Systems dilution from acquired earnings, or inventory growing faster than sales without corresponding orders.
Earnings Quality and Cash Conversion
Quarterly cash-flow calculations below subtract two reported cumulative statements. These are author calculations, not directly reported quarterly line items. Amounts are USD.
Metric | Quarter | Cumulative less preceding cumulative | Calculated quarter | Sources |
|---|---|---|---|---|
Operating cash flow | 2026-07-01 to 2026-09-30 | $1,745,000,000 (2026-09-30) minus ($1,036,000,000; 2026-06-30) | $709,000,000 | Statements through 2026-09-30 and 2026-06-30 |
Operating cash flow | 2025-07-01 to 2025-09-30 | $1,230,000,000 (2025-09-30) minus ($699,000,000; 2025-06-30) | $531,000,000 | Statements through 2025-09-30 and 2025-06-30 |
Capital expenditure | 2026-07-01 to 2026-09-30 | $345,000,000 (2026-09-30) minus ($198,000,000; 2026-06-30) | $147,000,000 | Statements through 2026-09-30 and 2026-06-30 |
Capital expenditure | 2025-07-01 to 2025-09-30 | $329,000,000 (2025-09-30) minus ($221,000,000; 2025-06-30) | $108,000,000 | Statements through 2025-09-30 and 2025-06-30 |
Where the issuer reports cash flow and capital expenditure cumulatively, the standalone-quarter cash-flow figures are derived by subtracting the preceding cumulative filing. They are calculations from SEC facts rather than separately reported quarterly line items.
Reported earnings converted into cash reasonably well in the latest quarter. Operating cash flow for July–September 2026 was a derived $709 million, calculated by subtracting the $1.036 billion cumulative amount for January–June from the $1.745 billion cumulative amount for January–September. Capital expenditure for the same quarter was a derived $147 million, calculated from cumulative payments of $345 million less $198 million. The resulting $562 million is an author-calculated accounting operating-cash-flow-minus-capex proxy, not a company-reported quarterly line item and not normalized owner earnings.
The trailing comparison is also constructive. Trailing-twelve-month operating cash flow was $2.399 billion, and capital expenditure was $469 million, producing a $1.930 billion accounting free-cash-flow proxy through September 30, 2026. That proxy equals about 19.8% of trailing revenue and 2.5% of the October 29, 2026 market capitalization. It is a useful cash-flow anchor, but not proof of sustainable earnings because the filing does not separate maintenance capital expenditure from growth spending or establish a through-cycle pricing and utilization level.
Quality cautions are visible. Nine-month 2026 net income included a $93 million gain on the Savannah disk-forging divestiture recorded in restructuring and other credits. The effect is identifiable, but a disposal gain does not represent recurring manufacturing earnings. Stock-based compensation was $80 million in the nine months, a noncash expense but still an economic cost and a potential source of dilution. Shares outstanding fell from 401.6 million at December 31, 2025 to 397.7 million at September 30, 2026, so buybacks more than offset equity compensation in the period.
The balance sheet is less conservative than the cash-flow statement alone suggests. At September 30, 2026, cash and equivalents were $507 million. The selected debt basis includes $391 million of current debt including short-term borrowings and $4.052 billion of noncurrent long-term debt, producing total debt of $4.443 billion and net debt of $3.936 billion. This selected basis uses current carrying-value components as of September 30, 2026; no reported long-term aggregate or reconciliation difference is available. The older December 31, 2025 long-term-debt aggregate is excluded, and no face-value debt substitute is used.
Liquidity is available but not unlimited. The company had $1.6 billion of revolving credit facilities with no borrowings at September 30, 2026, plus a $1 billion commercial-paper program with $390 million outstanding. All three major rating agencies maintained investment-grade ratings. The CAM and Brunner acquisitions were funded with debt, commercial paper, and cash, leaving interest expense higher and the business less able to absorb a sharp demand or cash-flow downturn.
Business Quality, Moat, and Industry Position
Howmet’s industry position is strongest as a direct, upstream supplier of engineered aerospace components, not merely a component of the final aerospace theme. It converts nickel, titanium, aluminum, and cobalt into castings, rings, fasteners, forgings, extrusions, machined parts, and assemblies that enter aircraft engines and airframes. End demand ultimately comes from commercial airlines and aircraft builders, defense programs, gas-turbine operators, and truck manufacturers. Customers are concentrated in demanding aerospace supply chains, but the filing excerpts do not identify specific customers or quantify customer concentration.
The moat is plausibly based on qualification, process know-how, material science, production scale, and the cost and time required to certify engineered components. Howmet says its products can cover more than 90% of structural and rotating aero-engine components. In the third quarter, Engine Products delivered $567 million of segment adjusted EBITDA, and Engineered Structures increased margin through productivity despite lower reported sales. These are observable indicators of process advantage and operating discipline.
The moat has limits. Fastening Systems’ margin fell after acquisitions, and Engineered Structures’ revenue declined because of portfolio rationalization. These events show that mix, integration, and footprint decisions can dilute otherwise attractive industry economics. Competition, new technologies, quality failures, supplier disruptions, and customers’ bargaining power remain risks. No external customer interviews, supplier checks, program-level backlog disclosures, or competitor evidence are provided, so the durability judgment remains lower confidence than the financial record.
Howmet is best classified as an important participant rather than a proven core bottleneck. Mission-critical products can create qualification barriers, and capacity expansion may support constrained aerospace supply chains. Yet the filing does not establish that competitors cannot add capacity, that customers cannot dual-source, or that Howmet captures most industry economics. On the six considerations—substitutability, capacity elasticity, qualification barriers, concentration, visibility, and value capture—the evidence supports a score of 3 out of 5. Strategic importance is clear; monopoly-like bottleneck power is not.
Management and Capital Allocation
Observable conduct shows both operating discipline and financial ambition. Management has divested a noncore forging facility, rationalized products, invested in capacity, and pursued acquisitions that expand fastening systems and aerospace-program exposure. It also reports effective internal controls, provides detailed segment and end-market information, and discloses risks and non-GAAP reconciliations. These are positive culture and disclosure indicators, though they do not reveal everything about how decisions are made internally.
Capital allocation is more mixed. Through September 30, 2026, Howmet spent $1.929 billion net of acquired cash on CAM and Brunner, repurchased $1.100 billion of stock, paid $153 million in dividends, and spent $345 million on capital expenditure. Debt issuance and commercial-paper borrowing helped fund the combination. The acquisitions have strategic logic: CAM adds fasteners, fittings, and connectors serving aerospace and defense programs. But preliminary purchase accounting created $1.096 billion of goodwill and $425 million of intangibles for the two transactions, while tangible book value is negative after liabilities and goodwill are considered. Integration and returns on acquired capital therefore require monitoring.
The repurchase record deserves caution. During the third quarter, Howmet purchased 1.888 million shares at an average price of $264.77, above the October 29 market price of $195.19. Share repurchases reduced the share count, but buying at demanding valuations can destroy value even if the accounting share count falls. The board expanded the authorization on October 28, 2026, which increases flexibility but also raises the risk of capital allocation becoming price-insensitive.
Management’s stated focus is long-term growth in attractive aerospace and gas-turbine markets, not a high-payout model. That can create value if incremental capital earns attractive returns and demand persists. The opportunity cost is substantial: every dollar used for acquisitions, debt service, capacity, or buybacks competes with debt reduction, dividends, or reinvestment in existing assets. An authorization alone is not evidence of good allocation; acquisition synergies and repurchase prices must ultimately be judged against the capital committed.
Valuation and What the Market Already Expects
As of October 29, 2026 at 1:50 p.m. UTC, HWM’s last sale price was $195.19 and its authoritative market capitalization was $77.842 billion. The trailing accounting free-cash-flow proxy of $1.930 billion through September 30, 2026 represents only about 2.5% of that equity value. The market therefore appears to require substantial and durable cash-flow expansion, not merely continuation of the latest quarter.
The dated enterprise value is approximately $81.778 billion using the selected $3.936 billion net-debt adjustment. This is not the same as market capitalization, which already represents equity value. The bridge is: enterprise value plus $507 million of cash minus $4.443 billion of total debt equals approximately $77.842 billion of equity value.
The valuation burden is especially important because Howmet is capital intensive and cyclical. A reverse-DCF calculation indicates that the dated market capitalization appears to require approximately 14.8% annual free-cash-flow growth, an analytical model result rather than management guidance.
That expectation must be tested against the economic cycle. Strong aerospace demand, gas-turbine investment, acquisitions, and capacity expansion can sustain growth, but current margins may reflect favorable volume and pricing. A mid-cycle case would require evidence that utilization remains sound after capacity additions, tariff recovery does not lag, inventory does not become excess, and acquired businesses earn acceptable returns without persistent margin dilution. The downside case is not merely lower revenue: it is lower pricing, under-utilized plants, higher working capital, and capex that must continue while operating cash flow falls.
The conclusion is qualitative because the available ten-year valuation already contains the scenario arithmetic. The dated price sits materially above the base case and therefore does not offer a Graham-style margin of safety. Even an optimistic long-duration outcome does not erase the central problem: investors are paying today for several years of unusually favorable execution.
Ten-Year Cash Flow to Fair Market Value
The starting free cash flow is the normalized SEC cash-flow proxy, while every growth rate, discount rate and terminal rate below is an explicit editorial assumption rather than company guidance. Each annual cash flow is forecast and discounted separately; terminal value is year-ten free cash flow multiplied by one plus terminal growth, divided by discount rate minus terminal growth, and then discounted back ten years. Fair market capitalization equals that explicit ten-year present value plus discounted terminal value and a same-date balance-sheet adjustment when available. If current cash and debt facts do not share one report date, the table shows the adjustment as unavailable and conservatively applies zero. The share count is derived from the dated market capitalization and share price so US shares and foreign ADRs use a consistent traded-security denominator.
Year | Bear FCF | Base FCF | Bull FCF |
|---|---|---|---|
1 | $2.04B | $2.16B | $2.27B |
2 | $2.16B | $2.41B | $2.68B |
3 | $2.28B | $2.69B | $3.15B |
4 | $2.41B | $3.01B | $3.71B |
5 | $2.55B | $3.36B | $4.37B |
6 | $2.63B | $3.56B | $4.7B |
7 | $2.71B | $3.77B | $5.06B |
8 | $2.79B | $3.99B | $5.45B |
9 | $2.87B | $4.23B | $5.87B |
10 | $2.96B | $4.48B | $6.32B |
Scenario | Growth years 1–5 / 6–10 | Discount | Terminal | 10-year PV | Terminal PV | Balance-sheet adjustment | Fair market cap | Fair value/share | Margin of safety | Terminal share |
|---|---|---|---|---|---|---|---|---|---|---|
Bear | 5.8% / 3.0% | 11.0% | 2.0% | $14.5B | $11.8B | -$3.94B | $22.3B | $56 | -248.6% | 45.0% |
Base | 11.8% / 5.9% | 9.0% | 3.0% | $20.4B | $32.5B | -$3.94B | $49B | $123 | -59.0% | 61.4% |
Bull | 17.8% / 7.6% | 8.5% | 3.5% | $26.6B | $57.8B | -$3.94B | $80.5B | $202 | 3.3% | 68.5% |
In the reverse-DCF, holding the 9% discount rate and 3% terminal growth fixed, and solving only for one constant growth rate rather than using the base-case growth path, the current market capitalization implies roughly 14.8% annual free cash flow growth for ten years. This is a sensitivity framework, not a price target: the terminal-value share shows how strongly each result depends on assumptions beyond the explicit forecast. For positive scenario equity values, negative margin of safety means the current market capitalization exceeds the scenario value. For zero or negative scenario equity values, a margin-of-safety percentage is not meaningful; the obligations exhaust the modeled enterprise value.
Five Value-Investing Lenses
Benjamin Graham Lens
Howmet is not a classic low-risk balance-sheet bargain. Net debt was $3.936 billion at September 30, 2026, tangible book value was negative, and goodwill plus intangibles were substantial. Investment-grade ratings and unused revolving facilities reduce refinancing risk, but they do not create a Graham-style liquidation floor. The market capitalization materially exceeds the base valuation, so the dated price offers little protection against a mid-cycle earnings reset. A famous aerospace franchise is not cheapness, and neither a falling share price nor strong reported growth is decisive. On Graham’s test, the company is understandable and financially viable, but its equity lacks an asset-based margin of safety at the October 29, 2026 price.
Benjamin Franklin Lens
A modern Franklin test asks whether management saves and compounds capital while weighing better opportunities. Howmet has increased investment, bought businesses, paid dividends, and repurchased shares, including at prices above the later market price. The acquisitions can create value if they add difficult-to-replicate aerospace content and acceptable returns; otherwise, debt-funded growth becomes an expensive substitute for disciplined compounding. A prudent approach would direct surplus cash first toward balance-sheet resilience and high-return reinvestment, then compare repurchases with the expected return on those uses. The opportunity cost is now large because debt service and integration compete with buybacks. The company’s thrift is visible; its capital-allocation verdict remains open.
Warren Buffett Lens
The Buffett-style starting point is owner economics, not the accounting free-cash-flow proxy alone. Operating cash flow less all capital expenditure was $1.930 billion for the twelve months ended September 30, 2026, but this is not normalized owner earnings because maintenance and growth capex are not separated and cycle position is uncertain. Depreciation is a useful proxy for the economic cost of consumed plant, but not a complete proxy here. The business generates substantial cash, yet acquisitions created $1.521 billion of goodwill and intangibles and were debt-funded. The owner-earnings question becomes attractive only if mid-cycle cash remains strong after maintenance needs, integration costs, working capital, and a reasonable return on expansion. At the dated market price, the burden is too high.
Charlie Munger Lens
Munger’s check is incentives, inversion, and bias. Management uses segment adjusted EBITDA to judge performance and resource allocation, while investors may overfocus on that non-GAAP measure; GAAP operating income and cash remain the cross-check. The repurchase program creates a powerful incentive to support the stock, and the October 2026 authorization makes discipline more important, not less. Inverting the thesis exposes clear failure modes: aerospace demand slows, capacity additions arrive after demand weakens, tariffs cannot be recovered promptly, acquired margins remain diluted, or debt costs rise while cash conversion falls. The most likely wrong assumption is that current growth and margins represent a durable new baseline. Attention to aerospace headlines, AI-linked gas-turbine narratives, or share-price momentum could obscure that risk.
Li Lu Lens
Li Lu’s circle-of-competence test favors businesses whose economic durability can be understood through products, customers, and barriers to entry. Howmet fits more closely than a fashionable software story: metal components, qualification, production capability, and customer requirements can be investigated. Its engine and fastening products address performance-critical aerospace needs, while 68% of nine-month revenue came from aerospace markets. The durable advantage may rest on metallurgy, process knowledge, qualification, and scale, but external customer checks and program-level evidence are absent. Permanent-loss control also depends on integration, leverage, and valuation. The business is within a reasonable circle of competence; the October 29, 2026 price is not a durable-advantage bargain, because expectations leave little room for error.
Risks, Disconfirming Evidence, and What Would Prove This Thesis Wrong
The central risk is that an unusually favorable operating period becomes the valuation base. The first thesis breaker would be a sustained slowdown in commercial-aerospace or defense build rates, visible in Engine Products sales, Engineered Structures orders or revenue, and aerospace end-market growth. A second would be Fastening Systems continuing to dilute margin after CAM and Brunner despite revenue contribution, indicating that acquisitions are not achieving the expected economics. A third would be operating cash conversion weakening materially as receivables and inventory grow faster than sales, especially with capex remaining near management’s elevated 2026 plan.
Two additional breakers matter. Debt could remain elevated or rise if acquisitions, capex, and shareholder returns outpace operating cash generation; observable indicators are commercial-paper balances, total debt, interest expense, and weaker free-cash-flow proxy conversion. Another is pricing and utilization stress: tariff pass-through could lag, metal costs could rise faster than contractual recovery, or new capacity could be underused. Forged Wheels’ third-quarter margin compression already shows that inflation recovery can dilute percentage profitability even when revenue grows.
The most likely wrong assumption is that current aerospace, gas-turbine, and acquisition-led growth will persist long enough to offset a high market valuation while the company simultaneously reduces leverage. If Engine Products margins weaken, Fastening Systems fails to improve, inventory rises, and capex stays high, the conclusion would need to become more negative. Conversely, evidence that margins remain resilient, cash conversion improves, leverage falls, and growth broadens would weaken the overvaluation thesis, though it would not by itself establish a margin of safety.
Opportunity cost matters for an investor considering this stock: the same capital could remain in cash, repay debt, or fund another business with less cyclical exposure and a lower valuation burden. A permanent loss could result from paying an excessive price, then suffering both lower cash flow and multiple compression; balance-sheet leverage and acquisition goodwill would make that loss path worse.
Investment Conclusion
Howmet Aerospace is a high-quality cyclical manufacturer with strong recent execution, important aerospace exposure, observable technical capability, and substantial cash generation. Its latest quarter supports confidence in near-term operating momentum. However, the October 29, 2026 market capitalization materially exceeds the base valuation, and the current cash-flow yield is low. The share price therefore demands durable mid-cycle growth, strong acquisition integration, sustained utilization, and deleveraging; it does not provide Graham-style downside protection.
The conclusion is Overvalued at the dated price, not “Avoid pending better evidence,” because the business itself is understandable and financially viable. A more constructive stance would require a materially lower entry price, clearer evidence of normalized cash earnings, or balance-sheet repair that materially improves the equity bridge. This article is for educational purposes only and is not individualized investment advice.
Educational-use disclaimer: This article is for educational purposes only, does not consider any reader’s objectives or circumstances, and is not individualized investment, legal, tax, or financial advice. Investors should conduct their own due diligence and consider risk tolerance before making investment decisions.
This article is for research and educational purposes and does not constitute personalized investment advice.
Share this article