The investment case — and what could go wrong
- For the three months ended September 30, 2026, Martin Marietta reported revenue of $2.369 billion, up from $1.846 billion in the prior-year third quarter.
- Ready mix, asphalt and paving generally earn lower margins because inputs are volatile and competition is intense, according to the company.
- Where the issuer reports cash flow and capital expenditure cumulatively, the standalone-quarter cash-flow figures are derived by subtracting the preceding cumulative filing.
Selected from this article · 2026-11-05
Read on for the full pictureThe Quarter in Context
For the three months ended September 30, 2026, Martin Marietta reported revenue of $2.369 billion, up from $1.846 billion in the prior-year third quarter. Gross profit was $651 million, versus $611 million, but operating income fell to $438 million from $505 million. Net earnings from continuing operations were $256 million, versus $361 million; consolidated net earnings were $256 million, versus $414 million, because the prior year included $53 million from discontinued operations.
The quarter did not represent a clean post-acquisition operating picture. LNA closed on August 21, 2026, and the quarter included $84 million of acquisition, divestiture and integration expenses, compared with $5 million a year earlier. Reported revenue growth also reflects acquisition activity, including the QUIKRETE exchange completed February 23, 2026, rather than solely organic expansion. The filing’s unaudited pro forma comparison is more informative about the combined company: for the third quarter, pro forma revenue was $2.649 billion and pro forma continuing-operations earnings attributable to Martin Marietta were $350 million, compared with $2.407 billion and $442 million, respectively. Those pro forma amounts are informational, not forecasts.
The central investment tension is therefore not whether Martin Marietta is a good operator. It is whether an enlarged, more diversified business can generate enough through-cycle cash to justify a market capitalization of $39.527 billion at the November 5, 2026 market snapshot, when the price was $556.56.
Business Model and Profit Engine
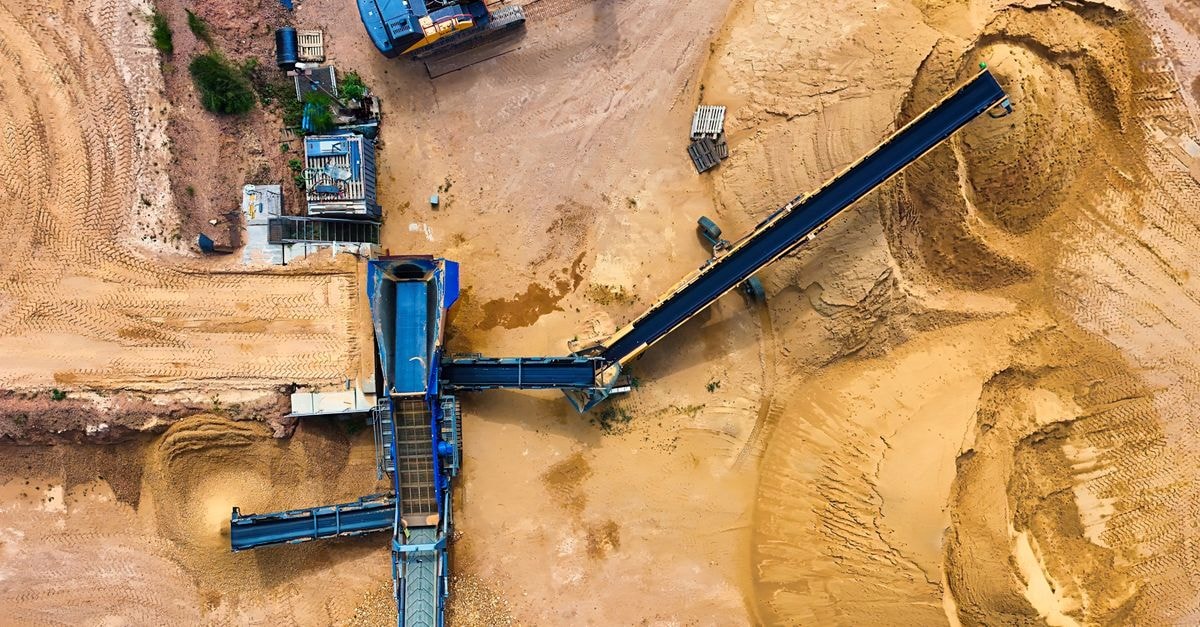
Customers pay Martin Marietta for locally delivered construction and industrial materials. Building Materials customers include public-infrastructure contractors, residential and nonresidential builders, ready-mix producers, paving contractors and other distributors who buy aggregates such as crushed stone, sand and gravel, plus asphalt, paving services and ready mixed concrete. Specialties customers buy lime, industrial minerals and magnesia-based products for steel, infrastructure, glass, environmental, agricultural, industrial and consumer applications. The building-materials business is principally transaction-based and exposed to construction cycles; Specialties is also transactional, but its end markets are more diverse. The filing does not supply recurring-revenue percentages.
The company has three reportable segments. East Group supplies aggregates; West Group supplies aggregates, asphalt and paving services, and ready mixed concrete; Specialties supplies lime, limestone and industrial minerals, magnesia-based products, and related products. Following the 2026 segment update, East and West encompass the former geographic divisions. In 2025, aggregates generated 88% of total reportable-segment gross profit, making aggregates the principal profit engine despite the addition of LNA to Specialties. Exact quarterly revenue, gross profit and operating profit for each segment are not available in the available evidence, so segment contribution and any cross-subsidy cannot be quantified.
The economic sequence is straightforward. Quarrying, mining, crushing, lime processing and magnesia production create product revenue. Selling, transportation, quarry and plant costs, energy, depreciation, depletion and amortization reduce revenue to gross profit. Selling, general and administrative expense plus acquisition and integration costs then determine operating profit. Working capital converts or consumes cash, while property, plant and equipment spending sustains or expands productive capacity. Because aggregates are expensive to transport, local reserve position and distribution density can support pricing; conversely, excess capacity or weaker demand can pressure utilization and operating leverage. Ready mix, asphalt and paving generally earn lower margins because inputs are volatile and competition is intense, according to the company.
Analytical inference: aggregates likely contribute disproportionate profit because freight economics and reserve scarcity permit local pricing power, while downstream products add cross-selling and service but carry more cost volatility. The filing does not separate maintenance from growth capital expenditure, so the portion required merely to preserve current capacity is unknown. Likewise, customer concentration data, backlog, pricing-volume decomposition and segment margins are unavailable. The profit engine would weaken if construction and industrial pricing fell faster than costs, utilization declined, acquired assets underperformed, or energy and transportation costs could not be recovered.
Earnings Quality and Cash Conversion
Quarterly cash-flow calculations below subtract two reported cumulative statements. These are author calculations, not directly reported quarterly line items. Amounts are USD.
Metric | Quarter | Cumulative less preceding cumulative | Calculated quarter | Sources |
|---|---|---|---|---|
Operating cash flow | 2026-07-01 to 2026-09-30 | $896,000,000 (2026-09-30) minus ($339,000,000; 2026-06-30) | $557,000,000 | Statements through 2026-09-30 and 2026-06-30 |
Operating cash flow | 2025-07-01 to 2025-09-30 | $1,156,000,000 (2025-09-30) minus ($605,000,000; 2025-06-30) | $551,000,000 | Statements through 2025-09-30 and 2025-06-30 |
Capital expenditure | 2026-07-01 to 2026-09-30 | $445,000,000 (2026-09-30) minus ($314,000,000; 2026-06-30) | $131,000,000 | Statements through 2026-09-30 and 2026-06-30 |
Capital expenditure | 2025-07-01 to 2025-09-30 | $602,000,000 (2025-09-30) minus ($412,000,000; 2025-06-30) | $190,000,000 | Statements through 2025-09-30 and 2025-06-30 |
Where the issuer reports cash flow and capital expenditure cumulatively, the standalone-quarter cash-flow figures are derived by subtracting the preceding cumulative filing. They are calculations from SEC facts rather than separately reported quarterly line items.
Nine-month operating cash flow was $896 million in 2026, compared with $1.156 billion in 2025. To derive the standalone third quarter, the author subtracts the cumulative operating cash flow through June 30, 2026 of $339 million from the cumulative amount through September 30, 2026 of $896 million, producing $557 million. The same method produces $551 million for the third quarter of 2025 from cumulative amounts of $1.156 billion and $605 million.
Capital expenditure requires the same derivation. The nine-month 2026 amount was $445 million, versus $602 million in 2025. Subtracting $314 million through June 30, 2026 from $445 million yields a derived third-quarter 2026 spending magnitude of $131 million; the corresponding 2025 calculation is $602 million less $412 million, or $190 million. Thus derived operating cash flow less capital expenditure was $426 million in the third quarter of 2026 and $361 million in the comparable 2025 quarter. These are author calculations from cumulative filings, not directly reported standalone cash-flow lines.
For the twelve months ended September 30, 2026, operating cash flow was $1.525 billion and capital expenditure was $650 million, producing an accounting free-cash-flow proxy of $875 million. This is a cash-flow proxy, not normalized sustainable owner earnings: the filings do not separate maintenance from growth capital expenditure, the acquisition materially changes the business, and cycle conditions matter. The proxy includes only reported operating cash flow less property, plant and equipment spending; it does not independently adjust acquisition integration costs, working-capital swings, leases or stock compensation.
Reported earnings require careful treatment. Nine-month consolidated net earnings of $2.020 billion included a $1.987 billion gain on divestitures and asset sales, with $1.428 billion classified in discontinued operations. Consequently, nine-month net earnings substantially overstate recurring earning power. Conversely, operating cash flow fell despite that gain because working capital and other operating changes absorbed cash. The cash-flow statement shows a $326 million receivables use, a $145 million inventory source and a $92 million accounts-payable source in the first nine months of 2026.
Balance-sheet protection weakened sharply with LNA. At September 30, 2026, cash and cash equivalents were $140 million, while current maturities of long-term debt were $720 million and noncurrent long-term debt was $12.103 billion. Total debt is therefore $12.823 billion. Restricted cash was another $12 million, but it was designated for replacement assets under a like-kind exchange and was not treated as freely available equity cash. Short-term borrowings were not separately available, so they are not assumed to be zero.
Business Quality, Moat, and Industry Position
Martin Marietta’s most credible competitive advantage is local aggregates scarcity combined with a dense operating and distribution network. The company operated approximately 500 quarries, mines and distribution yards in 29 states, Canada and The Bahamas as of September 30, 2026, compared with approximately 400 in the 2025 annual report. Aggregates are heavy and freight costs are high relative to product value, so nearby reserves, quarries and distribution yards can matter economically. The company also reports 13 active underground aggregates mines in the East Group.
The demand base is broad but cyclical. Public infrastructure accounted for 37% of 2025 aggregates shipments, with the remainder tied mainly to nonresidential and residential construction and other uses. Weather, infrastructure funding, interest rates, private construction and regional economies affect volumes and pricing. Seasonal patterns are material: winter affects the first and fourth quarters, while precipitation and heat affect the second and third. This limits the usefulness of any single quarter as a proxy for durable earning power.
LNA expands the upstream Specialties position. At acquisition, the filing described 20 quarries and production facilities, 45 distribution terminals and more than two billion tons of high-calcium limestone reserves. Preliminary purchase accounting assigned $3.2 billion to mineral reserves and $5.969 billion to identifiable intangible assets, while creating $4.396 billion of goodwill. The transaction therefore adds geological assets and diversification, but much of the purchase price depends on reserves, acquired intangibles and future integration.
Supply-chain position is important but not proven to be a dominant bottleneck. Upstream inputs include mineral reserves, land, energy, explosives, diesel, natural gas, coal, petroleum coke, cement and asphalt; midstream capabilities include quarrying, processing, lime and magnesia plants, and distribution; downstream customers are contractors, producers and industrial users. Transportation, permits and locally suitable reserves can constrain supply, but the evidence does not establish exclusive capacity, customer dependence or pricing power sufficient for a core-bottleneck classification. The appropriate classification is important participant, with a score of 3 out of 5. External customer, supplier and competitor checks are missing.
Management and Capital Allocation
Martin Marietta has a long acquisition-led history: the 2025 annual report says it has completed more than 100 acquisitions since its 1994 initial public offering. Recent actions show both strategic ambition and aggressive capital allocation. In 2026 it completed LNA for approximately $12.9 billion, paid $7.0 billion in cash and issued 10,953,543 shares valued at $5.9 billion, while the QUIKRETE exchange added aggregates operations and $450 million of cash in return for cement, ready-mix and land assets.
The LNA transaction appears strategically coherent: Martin Marietta bought an upstream lime and industrial-minerals platform that can extend its aggregates-led distribution system into complementary products. It also created a large financing and integration burden. Debt rose sharply, interest expense was $138 million in the third quarter, and the former LNA holder owned roughly 15% of Martin Marietta after closing. Shares outstanding increased from 60.3 million at December 31, 2025 to 71.1 million at September 30, 2026.
Observable capital-allocation facts are mixed. During the first nine months of 2026, the company spent $200 million on repurchases, $161 million on dividends, $7.872 billion on acquisitions net of cash acquired, and $445 million on property, plant and equipment. It funded the LNA cash consideration with roughly $7 billion of new debt, so shareholder distributions coexisted with substantial borrowing and dilution. That does not prove poor judgment, but it makes future deleveraging and integration outcomes more important than near-term repurchases.
Culture must be inferred cautiously. The filings show repeated portfolio refinement, willingness to use equity as acquisition consideration, and substantial disclosure of acquisition accounting and risks. They do not provide enough external evidence about employee retention, customer service, safety culture or management’s treatment of acquired operations. The culture test is therefore incomplete. Cultural capital matters because local customer relationships, operating discipline and regulatory conduct determine whether reserves and assets retain their value after acquisition.
Valuation and What the Market Already Expects
At the November 5, 2026 market snapshot, Martin Marietta’s share price was $556.56 and its authoritative market capitalization was $39.527 billion. The dated equity value is much larger than the September 30, 2026 trailing operating cash flow less capital expenditure of $875 million. That cash-flow yield is low relative to the valuation burden: the market is paying for substantial future growth, improved integration and sustained margins, not merely the latest trailing cash generation.
The balance sheet makes the burden stricter. Enterprise value begins with the market capitalization; adding available cash and subtracting debt gives equity value, not the reverse. On the selected September 30, 2026 basis, available cash was $140 million and total debt was $12.823 billion, producing a net-debt adjustment of $12.683 billion. Restricted cash of $12 million was excluded because it was committed to qualified replacement assets.
The market-implied growth sensitivity is also demanding. Under the valuation analysis assumptions, the dated market capitalization appears to require roughly 19.4% annual free-cash-flow growth from the $875 million base. This is a model sensitivity, not a company forecast. For a cyclical, capital-intensive business, such an expectation requires more than a strong quarter: it requires favorable pricing, adequate utilization, disciplined integration, successful deleveraging and no adverse cycle reversal.
The qualitative conclusion is straightforward. The business may be high quality, but the market price does not provide a Graham-style margin of safety. A sharp pricing decline, lower volumes, integration costs, rising interest expense or weaker cash conversion could compress both earnings and the valuation multiple. The price is therefore demanding rather than protective.
Ten-Year Cash Flow to Fair Market Value
The starting free cash flow is reported operating cash flow less reported total capital expenditure: an accounting cash-flow proxy, not normalized sustainable earnings or maintenance-capex owner earnings. Every growth rate, discount rate and terminal rate below is an explicit editorial assumption rather than company guidance. Each annual cash flow is forecast and discounted separately; terminal value is year-ten free cash flow multiplied by one plus terminal growth, divided by discount rate minus terminal growth, and then discounted back ten years. Fair market capitalization equals that explicit ten-year present value plus discounted terminal value and the supplied same-date balance-sheet adjustment. The supplied current cash and debt inputs reconcile to the dated adjustment shown below. Missing inputs are never treated as zero; an unavailable bridge would block this calculation. The share count is derived from the dated market capitalization and share price so US shares and foreign ADRs use a consistent traded-security denominator.
Year | Bear FCF | Base FCF | Bull FCF |
|---|---|---|---|
1 | $0.922B | $0.974B | $1.03B |
2 | $0.971B | $1.08B | $1.2B |
3 | $1.02B | $1.21B | $1.41B |
4 | $1.08B | $1.34B | $1.66B |
5 | $1.13B | $1.5B | $1.95B |
6 | $1.17B | $1.58B | $2.09B |
7 | $1.2B | $1.67B | $2.24B |
8 | $1.24B | $1.77B | $2.41B |
9 | $1.28B | $1.87B | $2.59B |
10 | $1.32B | $1.97B | $2.78B |
Scenario | Growth years 1–5 / 6–10 | Discount | Terminal | 10-year PV | Terminal PV | Balance-sheet adjustment | Fair market cap | Fair value/share | Margin of safety | Terminal share |
|---|---|---|---|---|---|---|---|---|---|---|
Bear | 5.3% / 3.0% | 11.0% | 2.0% | $6.45B | $5.25B | -$12.7B | -$0.98B | -$13.8 | Not meaningful (non-positive equity value) | 44.9% |
Base | 11.3% / 5.7% | 9.0% | 3.0% | $9.1B | $14.3B | -$12.7B | $10.7B | $151 | -269.0% | 61.1% |
Bull | 17.3% / 7.4% | 8.5% | 3.5% | $11.8B | $25.4B | -$12.7B | $24.6B | $346 | -60.9% | 68.2% |
In the reverse-DCF, holding the 9% discount rate and 3% terminal growth fixed, and solving only for one constant growth rate rather than using the base-case growth path, the current market capitalization implies roughly 19.4% annual free cash flow growth for ten years. This is a sensitivity framework, not a price target: the terminal-value share shows how strongly each result depends on assumptions beyond the explicit forecast. For positive scenario equity values, negative margin of safety means the current market capitalization exceeds the scenario value. For zero or negative scenario equity values, a margin-of-safety percentage is not meaningful; the obligations exhaust the modeled enterprise value.
Five Value-Investing Lenses
Benjamin Graham Lens
The Graham question is whether the balance sheet and price protect the investor against permanent loss. Martin Marietta had $12.823 billion of total debt against $140 million of unrestricted cash at September 30, 2026 after the LNA acquisition. Equity was $17.659 billion, but goodwill and intangibles were $14.912 billion, leaving only $2.747 billion of book equity before other adjustments—a weak tangible-loss-absorbing cushion. The dated market price also offers no visible Graham-style margin of safety. A famous franchise and a cyclical downturn are not substitutes for price protection.
Benjamin Franklin Lens
Franklin’s practical lens here is thrift, discipline and opportunity cost. The company did reduce property and plant spending, but it also borrowed about $7 billion and issued roughly 11 million shares for LNA while paying dividends and making a $200 million repurchase commitment in the first nine months. That is not automatically undisciplined if the acquisition creates durable value, but it raises the bar: returns on the whole transaction must exceed the financing, integration and dilution costs. At the dated price, the opportunity cost is also high because the market already expects strong cash-flow growth.
Warren Buffett Lens
Buffett’s lens focuses on owner economics and per-share capital allocation. A useful starting point is the $875 million trailing operating-cash-flow-minus-capital-expenditure proxy, but it is not owner earnings: maintenance and growth capital expenditure are not separated, and acquisition integration and working-capital effects matter. After subtracting the $12.683 billion net-debt adjustment, the resulting equity value is far below the dated market capitalization. The business may possess a good moat, but the acquisition must earn more than the cost of capital without further dilution.
Charlie Munger Lens
Munger’s lens asks what could make the obvious thesis wrong. The strongest incentives here are growth, scale and management credibility, while shareholders bear leverage and dilution. The most likely wrong assumption is that recent revenue growth and favorable pricing can continue long enough to absorb integration costs and justify the market price. Inversion therefore requires watching cash conversion and leverage, not merely reported revenue. The observable warning signs are weaker operating income despite revenue growth, acquisition-related charges, lower property spending, rising interest expense and continued equity issuance.
Li Lu Lens
Li Lu’s lens asks whether the durable advantage can be understood and whether permanent loss is controllable. Aggregates economics, reserve quality, freight costs and local distribution networks are understandable, but the new LNA platform adds substantial financial, geological and industrial complexity. The business may become more durable, yet the burden of proof is higher because integrations can destroy value even when acquired assets are strategically sensible. Risk control requires verified customer retention, employee and safety outcomes, acquisition synergies and deleveraging. Without that external evidence, long-horizon confidence should remain moderate rather than high.
Risks, Disconfirming Evidence, and What Would Prove This Thesis Wrong
At least three observable thesis breakers would force a more negative conclusion. First, pricing and operating leverage: a sustained decline in pricing or volumes causing gross or operating margins to compress despite revenue growth would show that current earnings are cyclical rather than durable. Second, cash conversion: operating cash flow falling while receivable days, inventory or acquisition-related cash needs rise would undermine the free-cash-flow base. Third, balance-sheet repair: failure to reduce net debt toward the company’s target, covenant pressure, a ratings downgrade or costly refinancing would weaken equity value.
A fourth breaker is acquisition execution. Sustained integration costs, customer or employee losses, impairment of the $4.396 billion LNA goodwill or acquired intangibles, and acquired operating cash flow below expectations would indicate that the strategic rationale did not translate into per-share value. A fifth is dilution: additional equity issuance without corresponding per-share cash-flow accretion would increase the burden on existing owners.
The most likely wrong assumption is that revenue and pricing momentum observed in 2026 can persist long enough to normalize the enlarged balance sheet. Opportunity cost is also material: buying at the dated price forgoes securities offering more margin of safety or the ability to buy after an industry downturn. Evidence that would change the conclusion includes sustained through-cycle free-cash-flow growth, successful deleveraging from internally generated cash, stable share count, and integration results demonstrating that the enlarged company produces stronger per-share economics.
Investment Conclusion
Martin Marietta is an economically important aggregates participant with real local-market advantages, a diversified industrial-products platform after LNA and demonstrable cash generation. Yet the September 2026 quarter also shows weaker operating income, heavy acquisition expenses, a much larger debt load and meaningful dilution. At the November 5, 2026 price of $556.56 and market capitalization of $39.527 billion, the valuation requires sustained strong cash-flow growth and successful execution, leaving little room for a cyclical or integration disappointment. The appropriate conclusion is Overvalued, not because the business lacks quality, but because the dated price lacks downside protection for this balance-sheet and capital-allocation risk.
This article is for educational purposes only and is not personalized investment advice.
Share this article