The Quarter in Context

Par Pacific reported second-quarter 2026 revenue of $2,968.9 million, up from $1,893.4 million in the prior-year quarter, with operating income of $634.6 million and net income attributable to stockholders of $462.1 million. The filing attributes the swing to a year-over-year increase in distillate revenue, which rose to $1,311.9 million from $727.0 million, and a smaller rise in gasoline revenue, which moved to $958.0 million from $680.4 million. Operating cash flow for the quarter, derived by subtracting six-month cumulative operating cash flow from the filing's six-month total, was $282.6 million, against six-month capital expenditure of $82.8 million. That derives an accounting free-cash-flow proxy of $242.9 million for the quarter, a figure that must be read as an author calculation from SEC facts rather than a separately reported line item.
The filing also discloses refinancing activity that reshapes the balance sheet: in May 2026 the company issued $500.0 million of 2034 notes and used proceeds, together with cash on hand, to repay the prior term loan. Cash and cash equivalents ended June 30, 2026 at $185.0 million, long-term debt net of current maturities was $738.2 million, and current maturities were $1.0 million. Diluted earnings per share for the quarter were $9.35, against $1.17 in the prior-year quarter, and share repurchases during the quarter totaled only $0.4 million, well below the $37.1 million repurchased during the first quarter. The board authorized a fresh $250 million repurchase program on February 20, 2026, of which $250.0 million remained available at quarter-end.
Business Model and Profit Engine
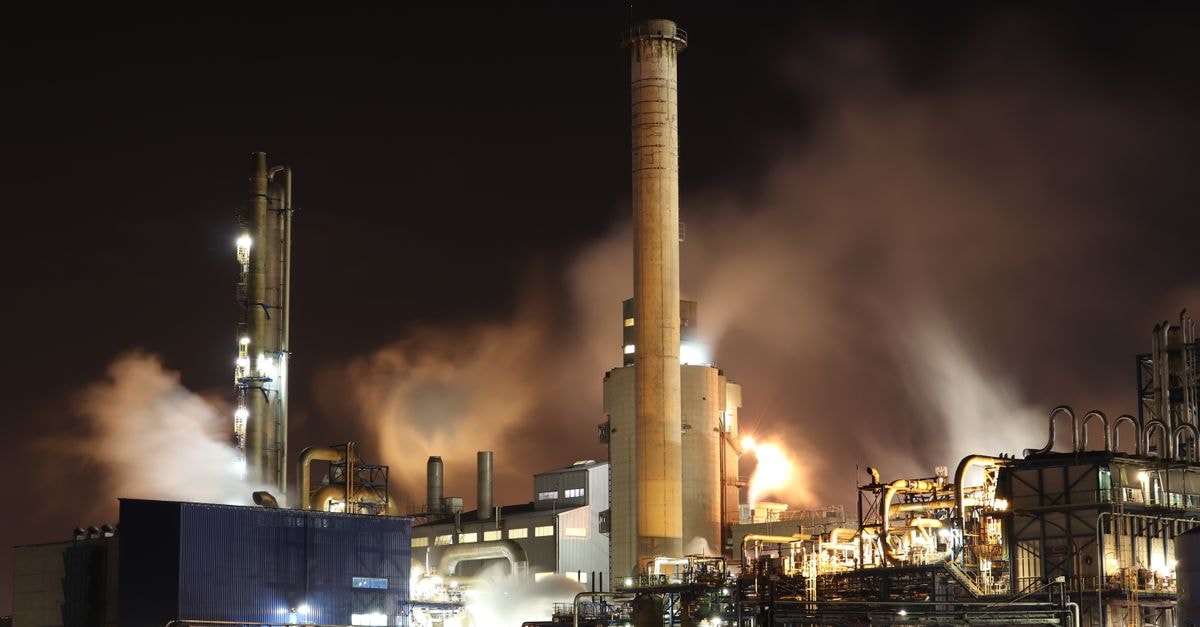
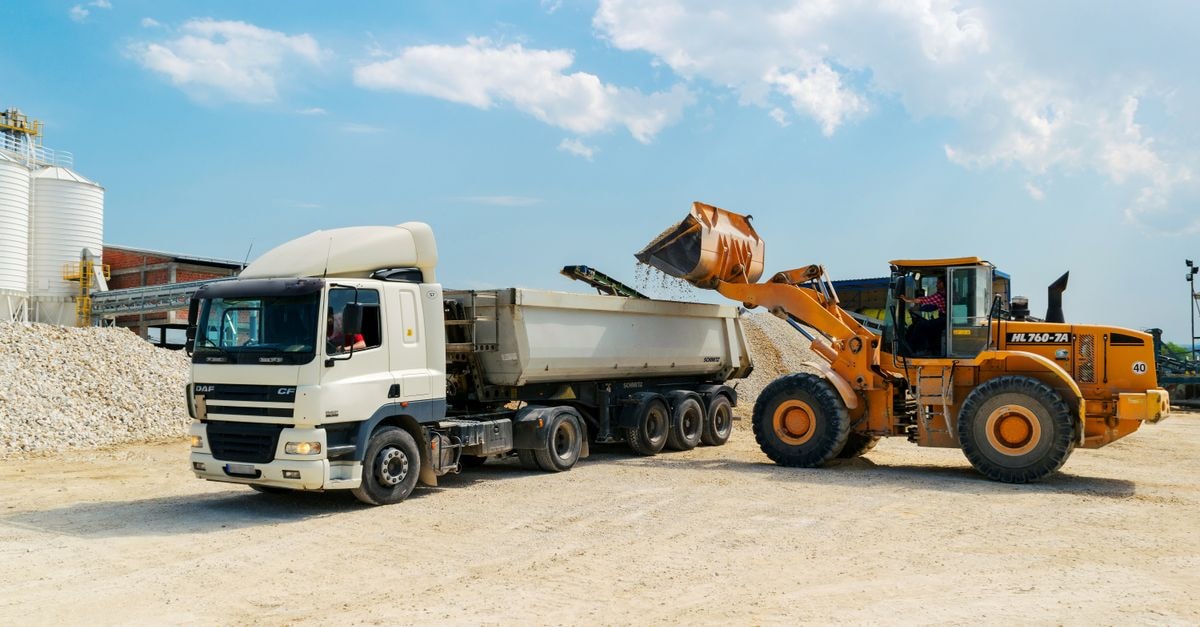
Par Pacific earns revenue from three reporting segments. Refining converts crude oil into gasoline, distillates and other products at four refineries with combined capacity of 219 Mbpd serving Hawaii and the U.S. Pacific Northwest and Rocky Mountain regions; Logistics operates pipelines, terminals, marine assets and rail loading for both internal and third-party product movement; Retail sells fuel and merchandise under the Hele, nomnom and 76 brands, plus third-party-branded sites and unattended cardlocks. In the second quarter of 2026, refining revenue was $2,905.1 million, logistics $79.6 million and retail $181.5 million, demonstrating that nearly all reported revenue still flows through refining. The customer base is therefore almost entirely wholesale refined-product buyers, government-related entities and retail fuel consumers, not industrial end-users.
Revenue converts into operating income mainly through refining crack spreads and logistics tariffs. Cost of revenues excluding depreciation was $2,116.2 million in the second quarter, against $1,593.5 million a year earlier, while depreciation and amortization was $36.5 million. Operating expense excluding depreciation of $157.1 million and G&A excluding depreciation of $28.0 million are largely fixed in the short run, which means gross profit carries meaningful operating leverage. Author inference: a substantial share of refining cost is variable crude plus feedstock cost, so reported margins can shift sharply with crack-spread moves and with the LIFO versus current-cost gap, which widened to $71.3 million at quarter-end from $9.1 million at year-end. The earnings engine therefore depends on three observable variables: crude input cost, the price of refined products, and refinery throughput.
Working capital is large and inventory-led: inventories grew to $1,441.2 million at June 30, 2026 from $1,228.8 million at December 31, 2025, while accounts receivable grew to $514.4 million from $312.7 million, and accounts payable grew to $539.5 million from $341.6 million. This is a capital-intensive structure, with $1,934.4 million of gross property, plant and equipment before accumulated depreciation of $707.1 million. Maintenance-versus-growth reinvestment is not separately disclosed; the filings describe profit-improvement projects, the Hawaii renewable hydrotreater and refinery turnarounds, but do not separate recurring from growth capex. The filings do not provide per-barrel unit economics, segment-level gross margin or customer concentration data, which is a data gap for finer unit-economics work.
Earnings Quality and Cash Conversion
Where the issuer reports cash flow and capital expenditure cumulatively, the standalone-quarter cash-flow figures are derived by subtracting the preceding cumulative filing. They are calculations from SEC facts rather than separately reported quarterly line items.
Reported earnings quality is mixed. Net income of $462.1 million was reduced by a $144.0 million tax expense and was flattered by equity earnings from joint refining and logistics investments of $7.5 million and $1.4 million of accretion from Laramie Energy, both non-cash contributors. On the negative side, the quarter included $11.5 million of debt extinguishment and commitment costs from the refinancing, an unrealized $48.0 million loss on derivative contracts over six months, and a $133.0 million deferred-tax charge over six months. The year-over-year swing in operating income from $96.8 million to $634.6 million is too large to be explained by volume alone and is consistent with a sharp widening of the 3-1-2 Singapore-style crack spread referenced in the 10-K.
Cash conversion was strong at the operating level but heavily distorted by working capital. Six-month operating cash flow of $241.9 million was reduced by a $222.5 million build in inventories, a $206.6 million build in receivables and $255.5 million in prepaid and other assets, partially offset by a $186.7 million build in payables and $37.4 million of deferred turnaround spending. The result is an accounting free-cash-flow proxy of approximately $159.1 million for six months, calculated as operating cash flow minus total capital expenditure of $82.8 million, a figure derived from SEC facts rather than reported separately. The filings do not split maintenance from growth capex, so this number cannot be labeled maintenance capex free cash flow. Six-month interest paid was $21.8 million and six-month taxes paid were $16.8 million.
Business Quality, Moat, and Industry Position
On the available evidence, the company is best described as an important participant, not a demonstrated core supply-chain bottleneck. This classification describes strategic position only; it is not independent proof of a moat or valuation upside.
The durable competitive position is geographic. Hawaii refining capacity is constrained by Jones Act economics, the single-point mooring at Kapolei, marine-vessel ownership, and the absence of pipeline access to mainland supply, all of which raise the cost of entry for any new competitor. The Washington, Montana and Wyoming refineries are located near inland crude and Rocky Mountain crude sources, with the Yellowstone pipeline and unit train-capable terminal providing logistics advantages that are difficult to replicate. These are structural bottlenecks rather than brand-based or scale-based moats, and their strength is tied to physical-asset and regulatory characteristics rather than management choice.
Beyond geography, the renewables joint venture with Mitsubishi and ENEOS through Hawaii Renewables adds a small but differentiated product stream, and renewable identification numbers (RINs) and other environmental credits contribute to both inventory and an offsetting obligation. Equity earnings from refining and logistics investments contributed $7.5 million in the quarter and $13.3 million for six months. What does not appear in the filings is a technology or cost-of-goods-sold moat versus mainland Gulf Coast or PADD 5 refiners; the company's pricing is determined by regional product markets that are still exposed to Pacific and global crude benchmarks. Author inference: a sustained drop in the 3-1-2 crack spread below mid-cycle assumptions would compress margins faster than Par Pacific could flex its fixed cost base.
Management and Capital Allocation
Management's capital allocation in the first half of 2026 prioritized refinancing and modest buybacks. The company issued $500.0 million of 7.375% notes due 2034 and used proceeds to retire the term loan, extending the maturity profile. It repurchased $37.1 million of common stock in the first quarter but only $0.4 million in the second quarter, leaving $250.0 million authorized under the refreshed program. Dividends are not paid and are not expected in the foreseeable future. The CEO, William Monteleone, and CFO, Shawn Flores, signed the 10-Q dated August 5, 2026, with disclosure controls and procedures concluded effective as of June 30, 2026.
Observable governance signals are limited but not concerning: the audit committee is chaired by an independent director, the proxy discloses standard NYSE governance structures, and the recent repurchase authorization was made after the share price fell, not before a run-up. What the filings do not provide is detailed per-segment return on invested capital, segment gross margin, or a quantified mid-cycle free cash flow range from management. Without these, the reader cannot verify management's own mid-cycle earnings power claim against actual data, and any inference about capital efficiency is author judgment, not filing fact.
Valuation and What the Market Already Expects
The dated market capitalization of $4,074.1 million and the dated share price of $81.32 were observed on September 6, 2026. The balance-sheet bridge from that equity value to enterprise value requires adding total debt of $739.2 million and subtracting cash of $185.0 million, yielding a net debt adjustment of $554.2 million and enterprise value of approximately $4,628.3 million. This gives a free-cash-flow yield of roughly 8.9% against the trailing twelve month accounting free-cash-flow proxy of $412.4 million, a yield sensitive to where one anchors cycle-normalized cash flow.
Reverse-engineering what the dated price already implies is the right discipline here. The reported second-quarter operating income of $634.6 million is unlikely to repeat quarter after quarter because Q1 2026 operating income was only $65.3 million. This dispersion means that annualizing Q2 would overstate earning power, while the full year 2025 operating income of $538.8 million may understate it on a mid-cycle basis. A reverse-DCF view that simply took Q2 free cash flow and capitalized it would assume a durable doubling of free cash flow versus full-year 2025, an aggressive read. A more defensible view is that the market is pricing something between an upper-cycle run-rate and a normalized mid-cycle outcome, with the deterministic base scenario capturing that balance.
Ten-Year Cash Flow to Fair Market Value
The starting free cash flow is the normalized SEC cash-flow proxy, while every growth rate, discount rate and terminal rate below is an explicit editorial assumption rather than company guidance. Each annual cash flow is forecast and discounted separately; terminal value is year-ten free cash flow multiplied by one plus terminal growth, divided by discount rate minus terminal growth, and then discounted back ten years. Fair market capitalization equals that explicit ten-year present value plus discounted terminal value and a same-date balance-sheet adjustment when available. If current cash and debt facts do not share one report date, the table shows the adjustment as unavailable and conservatively applies zero. The share count is derived from the dated market capitalization and share price so US shares and foreign ADRs use a consistent traded-security denominator.
Year | Bear FCF | Base FCF | Bull FCF |
|---|---|---|---|
1 | $0.445B | $0.474B | $0.499B |
2 | $0.481B | $0.545B | $0.604B |
3 | $0.52B | $0.627B | $0.731B |
4 | $0.561B | $0.721B | $0.884B |
5 | $0.606B | $0.83B | $1.07B |
6 | $0.624B | $0.888B | $1.17B |
7 | $0.643B | $0.95B | $1.29B |
8 | $0.662B | $1.02B | $1.41B |
9 | $0.682B | $1.09B | $1.55B |
10 | $0.703B | $1.16B | $1.7B |
Scenario | Growth years 1–5 / 6–10 | Discount | Terminal | 10-year PV | Terminal PV | Balance-sheet adjustment | Fair market cap | Fair value/share | Margin of safety | Terminal share |
|---|---|---|---|---|---|---|---|---|---|---|
Bear | 8.0% / 3.0% | 11.0% | 2.0% | $3.35B | $2.8B | -$0.554B | $5.6B | $112 | 27.2% | 45.6% |
Base | 15.0% / 7.0% | 9.0% | 3.0% | $4.98B | $8.44B | -$0.554B | $12.9B | $257 | 68.3% | 62.9% |
Bull | 21.0% / 9.8% | 8.5% | 3.5% | $6.58B | $15.6B | -$0.554B | $21.6B | $431 | 81.2% | 70.3% |
In the reverse-DCF, holding the 9% discount rate and 3% terminal growth fixed, and solving only for one constant growth rate rather than using the base-case growth path, the current market capitalization implies roughly -2.6% annual free cash flow growth for ten years. This is a sensitivity framework, not a price target: the terminal-value share shows how strongly each result depends on assumptions beyond the explicit forecast. Negative margin of safety means the current market capitalization exceeds the scenario value.
Five Value-Investing Lenses
Benjamin Graham Lens
Graham's discipline begins with the balance sheet. Par Pacific ended the quarter with $185.0 million of cash against $739.2 million of total debt, for a clear net-debt position of $554.2 million. Tangible book value is $1,845.2 million, and stockholders' equity is $1,982.4 million, so a reader can test whether the dated price offers margin of safety against liquidation value. Graham would also test whether current earnings power covers fixed charges; the company's interest expense was $14.3 million in Q2 against operating income of $634.6 million, a coverage ratio that is comfortable on the quarter but volatile over a cycle. The first quarter showed operating income of only $65.3 million, which means interest coverage at the recent trough was much tighter. Graham's core question, is this an investment or a speculation, depends entirely on whether the reader treats Q2 as representative or as a peak.
Benjamin Franklin Lens
Franklin's discipline, read here as modern thrift and opportunity cost, asks how efficiently capital is being turned into compounding shareholder value. The company has $1.4 billion of stated liquidity, including $185.0 million of cash and roughly $1.2 billion of availability under the ABL facility due 2031. It spent $82.8 million on capital expenditure during six months and $37.1 million on repurchases in Q1, but only $0.4 million on repurchases in Q2 even as the share price recovered, an example of capital waiting rather than capital deployed. The opportunity cost of holding $185.0 million of cash at the ABL spread versus paying down higher-coupon debt is small in this environment, but the alternative of buying back stock below the deterministic base-scenario fair value is the relevant comparison. Capital allocation discipline over the next four quarters will be a useful test of thrift versus complacency.
Warren Buffett Lens
Buffett's lens tests whether normalized owner economics justify the price, after adjusting for capital structure. Using trailing twelve month accounting free cash flow of $412.4 million, owner earnings roughly equal reported free cash flow because stock-based compensation of $16.8 million is small relative to scale. Adding back the $554.2 million net debt to the dated equity value gives enterprise value of about $4,628.3 million, an enterprise-value to free-cash-flow multiple near 11 times. Buffett would ask whether this multiple is justified by durable competitive advantage; the answer turns on whether Hawaii and inland-Pacific refining margins stay structurally above Gulf Coast refining margins over a full cycle. Buffett would also test capital allocation integrity, and the recent refinancing, which locked in 7.375% for eight years, looks like a defensible duration match against long-lived refinery assets. The risk is that the multiple reflects peak-cycle earnings rather than mid-cycle.
Charlie Munger Lens
Munger's lens inverts the question: what would have to be true for the dated price to be a permanent loss? Three inversions are worth naming. First, that the 3-1-2 crack spread reverts to a multi-year average rather than the recent quarter's level, which would compress refining margins well below Q2 2026. Second, that the company is unable to extend or refinance the 2034 notes or the ABL facility at reasonable cost when due. Third, that the renewables joint venture does not earn its expected return and becomes a perpetual capital sink. The most likely wrong assumption is that Q2 2026 is a new normal rather than a cycle peak. Opportunity cost matters: even if Par Pacific compounds at a healthy rate, an investor choosing it over a broad index is implicitly betting that the dated price already prices in the cycle risk; the valuation analysis suggests it may not.
Li Lu Lens
Li Lu's lens asks whether the business sits inside the investor's circle of competence, whether culture supports durable advantage, and how permanent loss is controlled. Refining is a commodity-processing business with periodic structural margin advantages, so the circle-of-competence test is whether the investor can independently assess regional crack spreads, capacity additions, and regulatory risk. Par Pacific's culture signals from the filings are limited but consistent: the CEO and CFO signed certifications, the audit committee has an independent chair, and disclosure controls were concluded effective. Permanent-loss control is the harder question, because a refiner can lose capital quickly when a turnaround goes wrong or when a regulatory fine is imposed. The filings reference ongoing consent decrees and the Wyoming operational incident from prior years, but do not quantify residual exposure. Without that quantification, a permanent-loss analysis remains incomplete.
Risks, Disconfirming Evidence, and What Would Prove This Thesis Wrong
The first observable thesis breaker would be a sustained 3-1-2 crack spread below $20 per barrel for more than two consecutive quarters, because that would compress refining margins below the company's break-even on a fully-loaded basis. The second would be a credit-rating downgrade triggered by either the 2034 notes or the ABL facility that materially raised the cost of refinancing the term loan replacement. The third would be a regulatory action related to environmental compliance that exceeded the $376.6 million environmental credit obligation already on the balance sheet. A fourth risk is the working-capital intensity visible in the $534.5 million of six-month operating-asset builds, which means reported free cash flow could turn negative if inventories and receivables unwind simultaneously with a margin drop.
Disconfirming evidence is already partly visible. The $48.0 million unrealized loss on derivatives over six months and the $11.5 million of debt extinguishment costs in the quarter show that reported earnings include items not aligned with cash. The $2.5 billion of intercompany logistics costs eliminated at the consolidated level implies a heavy reliance on intra-group product movement, which is value-capturing only if those tariffs are reasonable versus third-party rates. The most likely wrong assumption in the valuation analysis is that the trailing twelve month free cash flow is a reasonable mid-cycle base; if true mid-cycle free cash flow is closer to the 2024 level, which was negative on a reported basis, the dated price offers less margin of safety than the scenarios imply.
Investment Conclusion
The dated price of $81.32 and the dated market capitalization of $4,074.1 million sit well below the deterministic base-scenario fair market capitalization, and even below the bear-scenario fair market capitalization, which suggests that the market is partially pricing in a cycle reversion. The accounting free-cash-flow yield of roughly 8.9% against trailing twelve month figures is comfortable but not decisive on its own, because the underlying earnings reflect a strong refining margin environment that may not persist. The company's geographic footprint in Hawaii and inland-Pacific refining provides a structural, asset-based advantage that is hard to replicate, but refining is fundamentally cyclical and the second-quarter results should not be annualized. Given the deterministic result that the dated market capitalization is more than 20% below the base scenario, the appropriate conclusion is that the shares warrant watching as a potential cyclical value name once refining-margin normalization is better understood, rather than treating the dated price as a confirmed margin of safety today. Confidence in that conclusion is moderate because the filings do not provide a clean mid-cycle free-cash-flow anchor, segment-level gross margin, or unit economics; a reader who requires those should wait for additional disclosure before sizing a position.
This article is for educational and informational purposes only and does not constitute investment advice or a recommendation to buy or sell any security.
Share this article