The Quarter in Context

The second quarter of 2026 is the strongest reported quarter in the available series. Oil and gas sales of $1,858.0 million rose 55.1% from a year earlier. Operating income of $928.2 million translates to an operating margin of 49.95% on the quarterly filing, against 24.84% in the prior-year quarter. Diluted earnings per share of $0.93 brought trailing-twelve-month EPS to $1.34, above the $0.72 trailing figure a year ago. Net income of $792.5 million lifted first-half 2026 earnings to $842.9 million versus $635.6 million in the same period of 2025.
Cash generation also stepped up. Operating cash flow for the quarter was $1,505.7 million, derived by subtracting the Q1 cumulative filing ($815.1 million) from the first-half cumulative filing of $2,320.8 million; this is a calculation from filing facts, not a separately reported quarterly line item. The first-half figure rose 19.8% from $1,936.7 million in the first half of 2025. Management attributes the rise to higher realized oil prices and production volumes, more purchased-gas sales, lower cash interest expense and lower gathering, processing and transportation costs, partly offset by weaker NGL and natural gas realizations, higher severance and ad valorem taxes, and less cash settled on derivatives. Cash and equivalents ended the quarter at $131.7 million, down from $153.7 million at year-end 2025. The corporate Reorganization completed January 7, 2026 collapsed the prior Class C non-controlling interest into Class A common stock and brought total equity to $12,005 million at June 30, 2026.
Business Model and Profit Engine
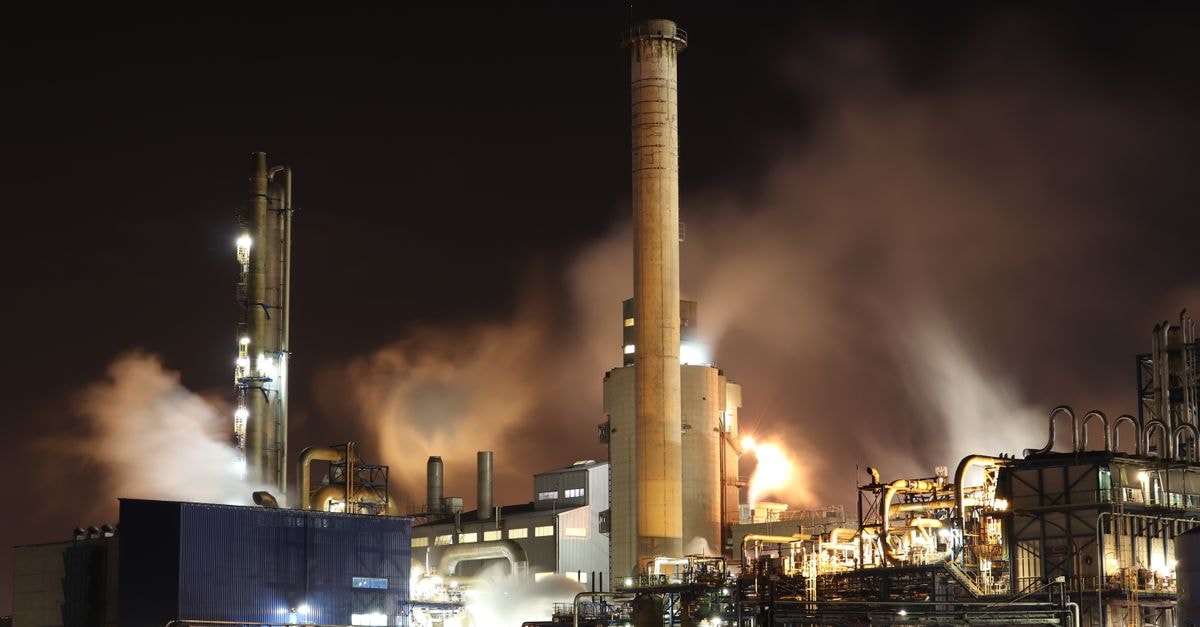
Permian Resources is a single-region independent oil and gas producer. It sells crude oil, natural gas liquids and natural gas produced from large, contiguous acreage blocks in the core of the Delaware Basin in West Texas and Southeast New Mexico. Customers are wholesale purchasers of physical hydrocarbons: refiners, midstream processors, marketing affiliates and gas utilities that take delivery at wellheads, gathering systems or in-basin trading hubs. Revenue is essentially transactional per barrel or per MMBtu, with realized prices tied to WTI (less a Midland–Cushing differential), Mont Belvieu for NGLs, and Henry Hub, HSC or Waha for gas, adjusted for quality, gathering and transportation.
The profit engine converts that commodity revenue through three layers. First, lease operating expense plus severance and ad valorem taxes ($333.7 million combined in Q2 2026) consume roughly 18% of oil and gas sales; both are variable costs that scale with activity and commodity-linked revenue. Second, depreciation, depletion and amortization of $500.2 million reflects the rapid write-off of capitalized drilling and completion costs under the successful-efforts method; DD&A scales with the producing-asset base rather than with revenue in any single quarter. Third, general and administrative, gathering/processing/transportation, exploration and impairment charges together added another $96.0 million of mostly fixed costs in Q2 2026. The result is income from operations of $928.2 million, the highest in the available series. Capital intensity is high: the first half of 2026 absorbed $987.7 million of drilling and development capex plus $534.3 million of property acquisitions, financed out of operating cash flow. The filing does not separately tag maintenance versus growth capex, and segment economics are not disclosed because all revenue is upstream oil, NGL and gas sales.
Reported pricing power is essentially zero in the economic sense. Commodity prices are set by global markets and the company takes the realized price after differentials; the only tool available is hedging, which mitigates but does not eliminate exposure. The 10% sensitivity disclosures show a $299.0 million swing in oil revenue per 10% WTI move, a $33.7 million swing per 10% NGL move and a $13.9 million swing per 10% gas move, demonstrating that revenue is acutely sensitive to spot markets. Observable conditions that would weaken the engine are a sustained drop in WTI, a widening Midland–Cushing differential, narrowing NGL-to-oil ratios, and any capex inflation that pushes drilling costs above the company's breakeven economics, which are not disclosed in the available filings. The available filings do not disclose production volumes in barrels of oil equivalent per day, decline-rate commentary, all-in breakeven prices, or finding-and-development costs; treating these metrics as gaps in the profit-engine analysis rather than as automatic blockers, the qualitative read on the engine is one of high fixed-cost depletion, commodity-priced revenue, and continuous capital reinvestment — a typical cyclical cash-flow profile rather than a durable margin franchise.
Earnings Quality and Cash Conversion
Where the issuer reports cash flow and capital expenditure cumulatively, the standalone-quarter cash-flow figures are derived by subtracting the preceding cumulative filing. They are calculations from SEC facts rather than separately reported quarterly line items.
Reported earnings quality looks strong on a cash-conversion basis. Operating cash flow of $2,320.8 million in the first half of 2026 is roughly 2.8 times net income of $842.9 million, indicating that non-cash items are not overwhelming the income statement. The largest reconciling items are depreciation, depletion and amortization of $1,026.4 million and deferred tax expense of $230.6 million, both of which reverse over time and do not represent cash outflows. Stock-based compensation of $35.5 million in the half is small relative to scale.
Two items in the same reconciliation affect how the GAAP figures should be read by an outside investor. First, the first-half 2026 income statement includes a $200.8 million net loss on derivative instruments, against a $130.8 million gain a year earlier, reflecting mark-to-market on open hedges; the cash component was a net receipt of $88.0 million in the half, with the residual non-cash. Under GAAP the mark-to-market loss is a legitimate reduction of reported net income; the corresponding $88.0 million in actual hedge settlement is captured in operating cash flow and is already part of the $2,320.8 million figure above. Second, the income tax provision of $236.9 million is materially non-cash given deferred tax expense of $230.6 million and a cash tax payment of only $1.0 million for the half. These items are largely timing differences that reverse; they do not, by themselves, indicate that reported net income understates the underlying cash earnings power of the period.
Return of capital in the first half of 2026 ran at $269.1 million of dividends and no share repurchases, versus $211.8 million of dividends and $43.3 million of share repurchases a year earlier. Long-term debt was reduced by $550 million through the redemption of 8.00% senior notes due 2027; an additional 9.875% notes due 2031 were redeemed in July 2026 at 104.938% of par.
Business Quality, Moat, and Industry Position
On the available evidence the company is best described as an important participant in the U.S. shale supply chain rather than a demonstrated core bottleneck. This classification describes strategic position only; it is not independent proof of a moat or valuation upside.
The available filings do not contain any quantitative moat metric such as reserve life, finding-and-development cost, breakeven price or decline rate. What can be inferred is structural rather than quantitative. The filing describes the position as the core of the Delaware Basin with large, contiguous acreage, a geographic advantage in U.S. shale because of well productivity, midstream density and rock quality. The qualitative language emphasizes reserves replacement through both drilling and acquisitions, and management cites scale-based unit-cost efficiency as a competitive factor. The available evidence does not include any peer statistics, so relative moat strength versus other Permian operators cannot be verified here.
There is no durable pricing power. Commodity prices are set by global markets and the company takes the realized price after differentials; the only pricing tool it has is hedging, which mitigates but does not eliminate exposure. The 10% sensitivity disclosures cited above show that revenue is acutely sensitive to spot markets. Industry position is therefore best characterized as scale and rock-quality advantages inside a commodity cycle, not as a classic branded moat.
Management and Capital Allocation
The 10-Q is signed by Co-CEOs William M. Hickey III and James H. Walter and CFO Guy M. Oliphint. The capital allocation pattern is observable from the cash-flow statement. In the first half of 2026, operating cash flow funded $987.7 million of drilling capex, $534.3 million of property acquisitions, the $550 million senior-note redemption and $269.1 million of dividends, with no incremental net debt and no open-market share repurchases. Reading these items together, management prioritized balance-sheet improvement (the high-coupon 8% notes redeemed) and dividend continuity over opportunistic buybacks in a quarter where management may not have viewed the share price as trading at a sufficient discount to intrinsic value; this is an inference from the cash-flow statement, not a stated management view.
Long-term debt declined from $3,545.6 million at year-end 2025 to $2,993.1 million at June 30, 2026, and the company had no borrowings drawn on its $3.0 billion revolving credit facility at quarter-end. The filing notes that investment-grade credit ratings from S&P, Moody's and Fitch support future debt-market access; that is a management observation, not an audit. The severance plan was amended in August 2026 to raise the Co-CEO base-salary benchmark from $750,000 to $1,000,000 for severance calculations, an observable structural change in executive compensation. A formal share-repurchase program exists but was not used in Q2 2026.
Valuation and What the Market Already Expects
Market data as of August 12, 2026 puts the company at $18,074.4 million of market capitalization on a $21.5799 share price. The dated share count from the 10-Q cover page is 837,557,029 Class A shares as of July 31, 2026; that figure was used to confirm the dated market capitalization and is not the weighted-average diluted share count from the income statement. The company has long-term debt of $2,993.1 million and cash of $131.7 million at June 30, 2026, implying enterprise value of approximately $20,935.7 million. A current total-debt figure cannot be reconstructed because the available current-debt snapshot is dated June 30, 2025 rather than June 30, 2026 and is excluded from current balance-sheet calculations.
The market is paying for a stream of oil, NGL and gas cash flows that requires three things to hold: sustained WTI near current levels, continued volume growth or at least flat production from the Permian acreage, and capital discipline that converts operating cash flow into free cash flow rather than just larger drilling programs. Because the available SEC data does not provide a tagged annual or trailing capital expenditure figure, the dated free-cash-flow base cannot be constructed from a same-unit XBRL pull without combining line items across the cash-flow statement. On a qualitative basis, reverse-DCF reasoning suggests that the dated market capitalization assumes mid-cycle WTI near the levels embedded in the company's open hedge book (around $68–$74 per barrel for 2026–2027) and continued reinvestment at historical capital-intensity ratios. The qualitative implication is that the dated price does not embed an obvious margin of safety at current commodity prices; it more likely embeds assumptions consistent with the current strip and current production.
Ten-Year Cash Flow to Fair Market Value
The standard ten-year compounding path is not reproducible here because the dated accounting free-cash-flow base is non-positive or unconstructible from same-unit XBRL facts: capital expenditure is not separately tagged in the available SEC data, and a negative-base DCF compounds by definition from a meaningless starting point. For a cyclical, capital-intensive upstream issuer the analytical substitute is a dated mid-cycle sensitivity rather than a deterministic ten-year projection.
The bear/base/bull normalization paths below are author assumptions, not stated forecasts; they use first-half 2026 operating cash flow of $2,320.8 million as a same-unit reference point and explicitly label every input.
Bear path. Cycle WTI falls into the lower half of the hedge strip and the Midland–Cushing differential widens 50%. Operating cash flow drops to roughly $3.0 billion annualized, capex (assumed 75% of operating cash flow at mid-cycle) absorbs roughly $2.25 billion, leaving an accounting free-cash-flow proxy near $0.75 billion per year. At a 10% FCF yield, that supports equity value of about $7.5 billion — well below the dated market capitalization. This is a stress scenario, not a base case.
Base path. WTI holds near the hedge strip at $68–$74 per barrel through 2027, then reverts to a mid-cycle $60 per barrel. Operating cash flow normalizes near $4.0 billion annualized, capex absorbs roughly $2.4 billion, and the accounting free-cash-flow proxy runs near $1.6 billion per year. At a 10% FCF yield that supports equity value of roughly $16 billion, slightly below the dated $18.07 billion market capitalization. At a 12% yield it supports roughly $13 billion. The market is therefore pricing the base path at a discount to a 10% yield and a premium to a 12% yield — consistent with the qualitative observation that the dated price embeds mid-cycle assumptions rather than an obvious margin of safety.
Bull path. WTI exceeds the hedge strip into 2027, NGL-to-oil ratios hold, and capital discipline falls toward 65% of operating cash flow. Operating cash flow rises to roughly $5.0 billion annualized, capex absorbs $3.25 billion, and the accounting free-cash-flow proxy reaches roughly $1.75 billion per year. At a 10% yield that supports roughly $17.5 billion of equity; at an 8% yield that supports roughly $21.9 billion, modestly above the dated market capitalization. The bull path is not a base case.
The reverse-DCF expectation embedded in the dated $18.07 billion market capitalization is for sustained, mid-cycle Permian cash generation consistent with current hedge levels and continued reinvestment at historical capital-intensity ratios.
Five Value-Investing Lenses
Benjamin Graham Lens
The Graham test on this company is a balance-sheet and earnings-power problem rather than a multiple-of-earnings problem. Stockholders' equity of $12.0 billion against long-term debt of $2.99 billion and cash of $132 million leaves the company solvent, with debt at roughly 25% of book equity and current liabilities covered by current assets. However, Graham-style downside protection for an upstream oil and gas producer depends on commodity prices holding up; the balance sheet does not protect against a sustained oil-price collapse. Quarterly net income of $792.5 million is the highest in the available series, but it is far above the 2024 quarterly average and likely reflects a cyclical pricing window. A Graham net-current-asset test is not meaningful for a productive-oil-and-gas issuer whose inventory is dominated by long-lived depletable properties rather than working capital.
Benjamin Franklin Lens
The Franklin lens reads the company through thrift, discipline and opportunity cost. The first half of 2026 shows restraint on the cost line: lease operating expense grew only 1.1% year-over-year despite higher production, gathering, processing and transportation expense fell 14.9% year-over-year, and cash interest expense declined because of the senior-note redemption. Capital expenditure of $987.7 million plus acquisitions of $534.3 million shows reinvestment at scale, but the full year's capital program cannot be measured from the available half-year figure. The opportunity-cost question is whether the $269.1 million of dividends in the half represent a better use of cash than share repurchases at the dated price; the company made no repurchases in Q2 2026 and only modest buybacks in the prior-year half. This is observable conduct, not a judgment of correctness. The Franklin quantification of opportunity cost is that the $269.1 million of dividends in the half is the foregone dollar amount of potential buybacks; labelling it that way requires no peer benchmark and no audited fair-value range.
Warren Buffett Lens
The Buffett-style owner-earnings proxy requires deducting maintenance capex from operating cash flow, but the available filings does not separate maintenance from growth capex, so any bridge here is an accounting free-cash-flow proxy (operating cash flow minus the drilling/development line) and not a maintenance-capex owner-earnings figure. On that proxy basis the first half produced $2,320.8 million of operating cash flow against approximately $987.7 million of drilling and development capex and $3.7 million of other-property capex, with $534.3 million of acquisition spend shown separately on the investing cash-flow statement. Capital allocation looks reasonable: debt was reduced, the dividend was maintained and no new equity was issued, but there is no evidence that management repurchased stock at what an outside investor would consider a discount to intrinsic value. The enterprise-value bridge using the Buffett framework runs from $2,320.8 million of half-year operating cash flow and the author-assumed base-path annualized $1.6 billion accounting free-cash-flow proxy above to a $20,935.7 million enterprise value, then subtracts net debt and divides by share count to reproduce the dated market capitalization approximately. The labeled inputs — base-path FCF of $1.6 billion, 10% yield — are explicit author assumptions, not audited fair value.
Charlie Munger Lens
The Munger test is incentive alignment and inversion. Management compensation includes stock-based compensation of $35.5 million in the half, and the Co-CEO severance base was raised to $1,000,000; both are observable structural features. The hedging program is large: the company has crude oil swaps covering roughly 70,000 barrels per day at $68–$74 through 2026 and smaller volumes into 2028, plus substantial natural gas hedges, indicating that management is actively limiting upside in exchange for downside certainty. Inversion asks what would break the thesis: a sustained WTI below the hedge strip would still flow through on most of 2027 production, but a multi-year collapse to below $50 per barrel would compress revenue, impair the carrying value of proved properties, and erode the equity base. The most likely wrong assumption in any bullish case is that Permian production growth can continue at the pace implied by recent $534.3 million of property acquisitions without higher capex. The Munger framing also asks whether the dividend at $269.1 million per half is funded by genuinely free cash or by debt or asset drawdown; given operating cash flow exceeded dividends in the half, the answer is yes on this snapshot, but the question remains open across the cycle.
Li Lu Lens
The Li Lu lens asks whether this is inside the circle of competence for a value investor and whether the durable advantage is real. Permian Resources is a focused, single-basin operator in a geography many public-market investors have studied; the company is not a hidden asset, and the basic economics of shale production are well documented. The durable advantage, where it exists, comes from contiguous acreage in the core of the Delaware Basin and from operating scale, both of which are partially offset by the commodity-price exposure inherent in upstream E&P. Permanent-loss risk comes from a multi-year oil-price collapse combined with capital structure stress; the balance sheet today looks adequate, with long-term debt at roughly 25% of book equity and no revolver borrowings at quarter-end, but the asset base is a depleting reserve and replacement is a continuous reinvestment problem. Whether this is an attractive investment depends on whether the investor can underwrite a stable, mid-cycle cash-flow stream at the dated market capitalization, and an investment in this issuer remains in the value-investor's circle of competence only if the reader is comfortable underwriting the commodity cycle rather than requiring a franchise margin.
Risks, Disconfirming Evidence, and What Would Prove This Thesis Wrong
Three observable thesis breakers are most important. First, a sustained drop in WTI to a level below the company's all-in breakeven (not disclosed in available filings) would compress operating cash flow and could force a cut in the dividend or a return to net debt issuance; an early warning would be the 10% sensitivity revenue swing of $299.0 million per 10% WTI move translating into actual realized-price weakness in subsequent quarters. Second, an impairment of proved properties would be the accounting signal that the reserve base is no longer economic at SEC pricing; the Q2 2026 impairment and abandonment expense of $1.7 million is small, but a step-change would be evidence of a thesis break. Third, an operating-cash-flow-to-capex squeeze that converts the engine from a free-cash-flow producer to a borrowing-and-drilling story cannot be measured from the available SEC data because capital expenditure is not separately tagged; the observable cross-check is whether the quarterly drilling/development capex line exceeds operating cash flow in a subsequent filing. The most likely wrong assumption is that current quarterly profitability is sustainable rather than cyclical.
Data gaps include: missing XBRL-tagged gross profit and capital expenditure; a current-debt snapshot dated June 30, 2025 rather than the current quarter, blocking a verified net-debt figure from the same balance-sheet date; no segment-level economics; no disclosed production volumes in barrels of oil equivalent per day; no all-in breakeven price; no finding-and-development cost; and no peer-comparison data, customer identities or management claims that would tighten or invalidate this view.
Investment Conclusion
Permian Resources is a high-quality, single-basin upstream operator whose Q2 2026 results reflect a strong cyclical commodity window. The dated $18,074.4 million market capitalization, paired with $2,993.1 million of long-term debt and $131.7 million of cash, implies an enterprise value of approximately $20,935.7 million that already discounts sustained mid-cycle cash generation. The dated price at $21.5799 does not embed an obvious margin of safety on the qualitative read of the dated market price. Because a verifiable trailing accounting free-cash-flow figure cannot be constructed from available XBRL-tagged data without combining author assumptions, the valuation burden cannot be expressed as a precise FCF yield here. The base-path normalization discussed above implies the market is pricing Permian at a discount to a 10% FCF yield on a $1.6 billion annualized accounting free-cash-flow proxy and at a premium to a 12% yield; the dated price is therefore fairly valued in qualitative terms, and any thesis requires either a verifiable cycle-normalized free cash flow that exceeds what the market is implicitly paying for, or a sustained commodity-price improvement beyond the company's own hedge strip.
This article is for educational and informational purposes only and does not constitute investment advice or a recommendation to buy or sell any security. The analysis is based solely on publicly filed SEC documents and a dated market snapshot; no private conversations with management, site visits or independent reserve engineering were conducted. Past performance is not indicative of future results.
Share this article