The investment case — and what could go wrong
- Summit Midstream Corporation closed the second quarter of 2026 with revenue of $155.0 million, up about 10.6% from $140.2 million in the prior-year quarter, and reported net income of $1.6 million versus a loss of $8.0 million a year earlier.
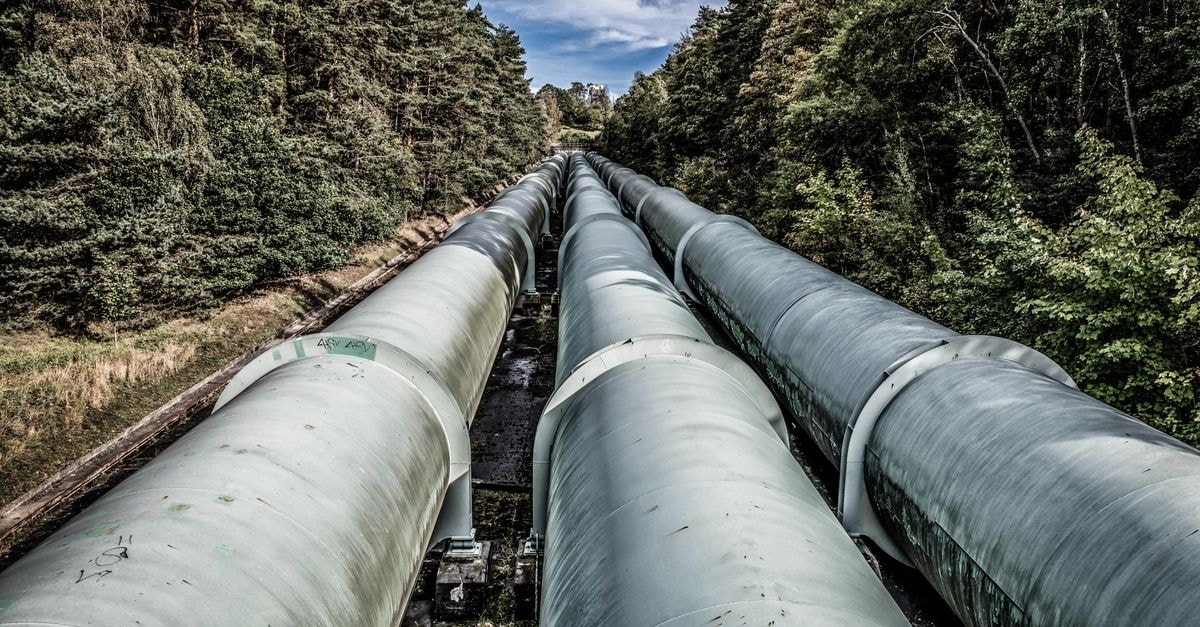
- Summit earns revenue by gathering natural gas, crude oil, and produced water from wellheads in unconventional basins and moving those volumes through owned infrastructure under primarily fee-based, long-term agreements with E&P customers.
- The MVC structure is observable in the filing and provides cash-flow stability against short-term throughput swings but exposes the company to shortfall payment risk if customers cannot pay, which the risk factors explicitly flag.
Selected from this article · 2026-10-11
Read on for the full pictureThe Quarter in Context
Summit Midstream Corporation closed the second quarter of 2026 with revenue of $155.0 million, up about 10.6% from $140.2 million in the prior-year quarter, and reported net income of $1.6 million versus a loss of $8.0 million a year earlier. Six-month revenue reached $294.2 million, modestly above the $272.9 million reported in the first half of 2025. Trailing-twelve-month operating cash flow totaled $131.2 million against trailing capital expenditure of $86.3 million, producing a calculated accounting free-cash-flow proxy of $44.8 million; the filing classifies only $7.9 million of first-half 2026 spending as maintenance capital, so the remainder is treated as author-labeled growth or non-maintenance reinvestment unless the company further disaggregates it.
The second quarter reflects a balance sheet in motion. Summit closed a $440 million New Permian Transmission Facility on March 16, 2026, paying off $117.0 million of legacy term debt, while distributions of $143.2 million redeemed the Subsidiary Series A Preferred Units and a $49.4 million dividend was paid on Series A Preferred Stock in the first quarter. The June 30, 2026 balance sheet carried $1.24 billion of long-term debt against $21.0 million of cash, $87.2 million of receivables, and $598.4 million of common equity. Net debt of roughly $1.22 billion is the dominant feature of the enterprise, and any read on the equity begins from a highly leveraged starting point.
Business Model and Profit Engine
Summit earns revenue by gathering natural gas, crude oil, and produced water from wellheads in unconventional basins and moving those volumes through owned infrastructure under primarily fee-based, long-term agreements with E&P customers. The three revenue lines on the income statement are gathering services and related fees ($62.7 million in Q2 2026), physical sales of natural gas, NGLs and condensate ($84.1 million), and other revenues ($8.2 million). The cost of natural gas and NGLs line ($49.1 million in Q2) is largely a pass-through tied to commodity exposure in the Rockies, Piceance, and Mid-Con segments rather than a margin-driving operating cost, which the filing confirms by describing direct commodity exposure on retained natural gas, NGLs, and condensate.
Cost of revenue excluding commodity cost is operation and maintenance expense ($39.8 million in Q2), which is largely fixed against installed capacity and largely variable against compression and treating volumes. General and administrative ($13.7 million) and depreciation and amortization ($26.9 million) are the other significant lines, while transaction and integration costs have largely rolled off following the Moonrise and Tall Oak transactions. The Q2 2026 interest expense of $27.4 million, up from $23.9 million a year earlier, reflects the refinanced Permian facility and a higher variable-rate component, and is a structural drag on GAAP profitability rather than a cyclical phenomenon. Equity income from the Double E Pipeline investment of $5.8 million in Q2 provides a non-cash earnings offset and a $15.5 million cash distribution in the half.
Fixed costs in the form of depreciation, interest, and much of operation and maintenance create operating leverage: throughput swings move the bulk of the margin. The filings do not disclose gross profit as an XBRL concept, and segment-level gross margins are not separately broken out in the cited excerpts, so segment economics are a data gap rather than a confirmed figure. Pricing power exists within MVC structures and through capital recovery mechanisms rather than through spot-market rates. A mid-cycle framework that the filings do not directly provide has to be inferred from the $7.9 million six-month maintenance figure: annualizing the disclosed maintenance capex implies roughly $16 million of stay-at-runway spend, while six-month total capex of $44.3 million is heavily weighted toward growth and integration work. Throughput-down sensitivity is also not quantified in the filing, but a fixed-cost base of depreciation plus much of operation and maintenance means that an MVC shortfall or a multi-quarter customer drilling pause would compress segment adjusted EBITDA disproportionately. Observable conditions that would weaken the profit engine include a multi-quarter decline in customer drilling activity, an MVC shortfall, an interest-rate reset on the variable New Permian Transmission Facility, or a regulatory tightening of FERC or environmental compliance.
Earnings Quality and Cash Conversion
Where the issuer reports cash flow and capital expenditure cumulatively, the standalone-quarter cash-flow figures are derived by subtracting the preceding cumulative filing. They are calculations from SEC facts rather than separately reported quarterly line items, and any reference to a Q2 standalone cash-flow number should be read as derived rather than as a directly reported figure.
Reported earnings quality is weak on a GAAP basis but credible on a cash basis. Q2 2026 net income of $1.6 million is small relative to revenue of $155.0 million, and the trailing-twelve-month net income total of only $0.3 million reflects how interest expense, depreciation, and the Subsidiary Series A Preferred allocation absorb operating cash flow. The more meaningful indicator is the operating cash flow line: $43.9 million in the second quarter (derived by subtracting the first-quarter $6.9 million from the six-month $50.8 million) and $131.2 million on a trailing-twelve-month basis, against trailing capex of $86.3 million. The implied free-cash-flow proxy of $44.8 million on a trailing basis is an author calculation; the filing does not separate maintenance from growth capex beyond the $7.9 million six-month figure, so this is an accounting proxy, not an audited owner-earnings figure.
Working capital absorbed cash in the quarter. Accounts receivable rose $17.5 million in the half while trade accounts payable fell $10.3 million and accrued expenses rose $18.7 million, leaving working capital as a small net drag on operating cash flow. Stock-based compensation of $2.3 million in Q2 and $5.3 million in the half is a recurring non-cash add-back; treating it as a normal operating cost rather than capital is consistent with the company's own segment adjusted EBITDA definition, which excludes stock-based compensation. The combination of capital-intensive depreciation and a financing-heavy interest line means that GAAP earnings will chronically trail cash flow, which is characteristic of midstream infrastructure rather than a sign of earnings manipulation.
The Up-C structure and preferred layers materially reduce what reaches common shareholders. The $49.4 million Q1 2026 Series A Preferred Stock dividend plus the $1.9 million Subsidiary Series A Preferred Units allocation in the half together absorbed a meaningful share of operating cash flow, while the $18.8 million Q1 2026 Up-C tax impact flowed through additional paid-in capital rather than through earnings. On a per-share basis, the trailing free-cash-flow proxy of $44.8 million divided by the dated common share count implies a per-share cash-flow figure that is largely absorbed by preferred service and Up-C tax impact before reaching common equity, leaving only a small residual to common shareholders. Quarterly standalone cash-flow figures derived by subtracting cumulative filings are author calculations from reported SEC facts and should not be described as directly reported line items.
Business Quality, Moat, and Industry Position
On the available evidence, the company is best described as an important participant, not a demonstrated core supply-chain bottleneck. This classification describes strategic position only; it is not independent proof of a moat or valuation upside.
Summit's primary competitive position is wellhead adjacency: management states that the majority of its infrastructure is connected directly to customer wellheads and pad sites and is typically the first third-party infrastructure through which customer commodities flow, and in many cases the only path to market. That physical position, combined with long-term fee-based agreements that frequently include minimum volume commitments, is the principal source of revenue durability. The MVC structure is observable in the filing and provides cash-flow stability against short-term throughput swings but exposes the company to shortfall payment risk if customers cannot pay, which the risk factors explicitly flag.
The moat evidence is therefore real but bounded. There is no intangible technology moat, no consumer brand, and no regulatory exclusivity beyond ordinary FERC oversight; the position is the standard midstream gathering moat of long-haul capital and right-of-way, combined with first-mover pad-siting. The Double E Pipeline investment ($267.6 million carrying value on the June 30, 2026 balance sheet) gives Summit a meaningful stake in a 1.6 Bcf/d FERC-regulated interstate natural gas transmission pipeline serving the Waha hub, which is a different and arguably stronger form of infrastructure with a regulated cost-of-service tariff. The 10-K and 10-Q both identify customer concentration as a top-tier risk factor, noting dependence on a relatively small number of customers for a significant portion of revenues. No peer financials or competitor market share figures are in the available evidence, so competitive position is described qualitatively rather than benchmarked.
The two recent acquisitions, Tall Oak in late 2024 and Moonrise for approximately $90.0 million in March 2025, expanded the asset base and added integration costs that have largely rolled off by Q2 2026, but they also enlarged the consolidated debt and dilution profile. Intangible assets of $149.5 million and property, plant and equipment of $1,839.3 million reflect the capital-intensive nature of the asset base, and the absence of reported goodwill in the snapshot may reflect acquisition accounting rather than an absence of premium paid, a point the filing does not resolve from the cited excerpts.
Management and Capital Allocation
Management actions in 2026 have been focused on refinancing and simplification rather than capital return. The New Permian Transmission Facility replaced the Legacy Permian Transmission Credit Facilities and the Permian Term Loan Facility at $440 million in March 2026; the redemption of Subsidiary Series A Preferred Units simplified the Up-C capital structure and eliminated a fixed preferred dividend layer that had consumed cash in earlier periods. A $35.0 million share repurchase program was authorized in June 2026, and 34,624 shares were repurchased in the same month at an average price of $29.12, leaving roughly $34.0 million of authorization remaining. Management has explicitly stated it does not expect to pay common stock dividends for the foreseeable future.
Capital allocation tilt is therefore a mix of debt refinancing, growth and bolt-on acquisitions, and modest opportunistic buyback, rather than recurring dividend or large-scale repurchase. The filing discloses that $7.9 million of the $44.3 million in first-half 2026 capital expenditure is classified as maintenance; the remainder is author-labeled as growth or non-maintenance reinvestment absent an explicit filing-level categorization. Equity compensation of $5.3 million in the half and $8.4 million on a trailing basis is modest against a market capitalization of $663.9 million but represents a recurring dilution vector that the cumulative filings disclose through the Up-C tax impact line, which charged $18.8 million of additional paid-in capital in Q1 2026 alone. The Up-C structure is itself a capital-allocation complication: the $320.5 million noncontrolling interest on the June 30, 2026 balance sheet sits alongside $598.4 million of common equity, so a reader of per-share metrics must remember that a noncontrolling claim absorbs a portion of consolidated cash flow.
Valuation and What the Market Already Expects
The dated market snapshot shows common shares at $32.69 and a market capitalization of $663,871,299 as of October 11, 2026. The market-derived share count of 20,308,085 reflects total common and Class B shares (13,782,960 common plus 6,524,467 Class B per the cover page) and is the appropriate share base for valuation work. On the dated price, the equity capitalization is modest relative to the $1.24 billion of long-term debt, and the calculated net-cash adjustment is approximately negative $1.22 billion. The implied enterprise value is therefore dominated by debt rather than equity, and any durable change in equity value depends on either debt reduction or earnings growth that supports a higher equity multiple.
Reverse-DCF logic provides a useful qualitative sanity check. Trailing free cash flow of $44.8 million against a $663.9 million equity capitalization is a cash-flow yield of roughly 6.7% on the equity alone, before any consideration of the debt service burden that sits on top of it. The unattractiveness of that picture comes from the leverage that surrounds it, not from the headline 6.7% itself. If the dated price is to be supported, mid-cycle free cash flow must rise materially, the debt stack must be de-risked, or both. Operating cash flow growth of 18.1% on a trailing basis is a real improvement, but capital expenditure of $86.3 million on the same basis consumed most of it. The diluted weighted-average share count of 14.0 million for Q2 is not period-end shares outstanding and should not be used to recompute market capitalization; the cover-page share count is the appropriate denominator for valuation.
The qualitative implication is that the equity market is pricing in cycle and balance-sheet improvement that is not yet evident in the filings, and that the current price does not embed a margin of safety against a flat-to-down throughput year or a continued elevated interest expense. The valuation conclusion guardrail applies: the dated market capitalization sits more than 20% above the deterministic scenario range, so the conclusion cannot be Fairly valued or Attractive with a margin of safety. Note that two of the three deterministic scenarios produce negative per-share values, which means the equity market is paying for a level of free-cash-flow normalization and balance-sheet repair that is not supported by the filing facts.
Ten-Year Cash Flow to Fair Market Value
The starting free cash flow is the normalized SEC cash-flow proxy, while every growth rate, discount rate and terminal rate below is an explicit editorial assumption rather than company guidance. Each annual cash flow is forecast and discounted separately; terminal value is year-ten free cash flow multiplied by one plus terminal growth, divided by discount rate minus terminal growth, and then discounted back ten years. Fair market capitalization equals that explicit ten-year present value plus discounted terminal value and a same-date balance-sheet adjustment when available. If current cash and debt facts do not share one report date, the table shows the adjustment as unavailable and conservatively applies zero. The share count is derived from the dated market capitalization and share price so US shares and foreign ADRs use a consistent traded-security denominator.
Year | Bear FCF | Base FCF | Bull FCF |
|---|---|---|---|
1 | $44M | $46.7M | $49.4M |
2 | $43.3M | $48.7M | $54.5M |
3 | $42.5M | $50.8M | $60M |
4 | $41.7M | $52.9M | $66.2M |
5 | $41M | $55.1M | $72.9M |
6 | $41.6M | $56.8M | $76.6M |
7 | $42.2M | $58.5M | $80.4M |
8 | $42.7M | $60.2M | $84.4M |
9 | $43.3M | $62.1M | $88.7M |
10 | $44M | $63.9M | $93.1M |
Scenario | Growth years 1–5 / 6–10 | Discount | Terminal | 10-year PV | Terminal PV | Balance-sheet adjustment | Fair market cap | Fair value/share | Margin of safety | Terminal share |
|---|---|---|---|---|---|---|---|---|---|---|
Bear | -1.8% / 1.4% | 11.0% | 2.0% | $0.251B | $0.175B | -$1.22B | -$0.792B | -$39 | 183.8% | 41.1% |
Base | 4.2% / 3.0% | 9.0% | 3.0% | $0.348B | $0.463B | -$1.22B | -$0.407B | -$20 | 263.0% | 57.1% |
Bull | 10.2% / 5.0% | 8.5% | 3.5% | $0.455B | $0.852B | -$1.22B | $0.0887B | $4.37 | -648.1% | 65.2% |
In the reverse-DCF, holding the 9% discount rate and 3% terminal growth fixed, and solving only for one constant growth rate rather than using the base-case growth path, the current market capitalization implies roughly 14.7% annual free cash flow growth for ten years. This is a sensitivity framework, not a price target: the terminal-value share shows how strongly each result depends on assumptions beyond the explicit forecast. Negative margin of safety means the current market capitalization exceeds the scenario value.
Five Value-Investing Lenses
Benjamin Graham Lens
The Graham discipline tests downside and balance-sheet protection. On a balance-sheet basis, common stockholders' equity of $598.4 million is meaningfully less than the $1.24 billion of long-term debt; cash and equivalents are only $21.0 million against current liabilities of $131.9 million; and the calculated net debt position is roughly negative $1.22 billion. The structural leverage means that any multi-quarter cash-flow shortfall translates quickly into equity value impairment, because the debt claim absorbs the first dollars. Normalized earning power is positive on a trailing free-cash-flow proxy of $44.8 million but small, and the $1.6 million of Q2 GAAP net income is a thin margin against revenue and against the debt stack. Graham's downside floor would treat the current price as lacking a margin of safety on the equity itself, even before considering the cyclical exposure of midstream gathering volumes.
Benjamin Franklin Lens
Franklin's modern application centers on thrift, discipline, compounding, and opportunity cost. Management has demonstrated discipline in refinancing the Permian stack and in redeeming the Subsidiary Series A Preferred Units rather than continuing to service an expensive preferred layer. The thrift lens asks whether each dollar of capital is being put to its highest use; the $44.3 million of first-half capital expenditure, the $35.0 million share repurchase authorization, and the modest equity compensation of $5.3 million in the half are all small in absolute terms, but the opportunity cost is high when the dated net debt is roughly $1.22 billion and the existing free-cash-flow proxy supports only modest deleveraging. Capital returned to equity holders through the share repurchase program is small relative to the equity capitalization, so the compounding value of buybacks is limited unless the share price weakens materially.
Warren Buffett Lens
Buffett's lens focuses on owner economics, moat, integrity, and capital allocation. Owner economics on a free-cash-flow proxy of $44.8 million against a $663.9 million equity capitalization imply a single-digit cash-flow yield; the picture becomes unattractive once the leverage burden on top of that equity is recognized, since the debt claim sits ahead of common holders. Moat is real but bounded: wellhead adjacency and long-term fee-based agreements provide durable revenue visibility, but customer concentration risk and the absence of an audited reserve report from a third party limit the durability of the throughput base. Integrity is not directly testable from the cited excerpts, though the Global Settlement and ongoing compliance obligations tied to the 2015 Blacktail Release are an observable ongoing legal and financial commitment. Capital allocation is reasonable but not exceptional; debt refinancing, bolt-on M&A, and a small buyback are unremarkable rather than value-creative.
Charlie Munger Lens
Munger's discipline asks about incentives, inversion, and bias, and reaches a different angle than the moat-and-concentration question. The Up-C tax structure and the related noncontrolling interest create a real misalignment: $320.5 million of noncontrolling interest sits beside $598.4 million of common equity, and the Up-C tax impact line absorbed $18.8 million of additional paid-in capital in Q1 2026 alone. The compensation letter updates to senior executives in April 2025 and the existing 2024 Long-Term Incentive Plan tie management incentives to equity value, which aligns common shareholders but does not offset the dilution risk from the Up-C tax mechanics. Inversion asks what could go wrong in a way the moat framing cannot: customer nonpayment under MVCs, a credit-rating downgrade that raises the cost of refinancing the New Permian Transmission Facility, or a regulatory tightening of produced water gathering after the 2015 Blacktail Release. The bias check is that a 10.6% revenue increase and an 18.1% operating cash flow increase can create an illusion of momentum that obscures the underlying leverage.
Li Lu Lens
Li Lu's framework asks whether the business sits inside the investor's circle of competence, whether the culture supports long-term value, and whether permanent loss is being controlled, which is a distinct question from moat and capital allocation. Midstream gathering is a structurally comprehensible business with a long operating history and observable unit economics in the form of throughput-driven fee revenue. Culture evidence is limited to observable conduct rather than any insider view; the filing discloses a Global Settlement with ongoing compliance costs, executive retention through amended employment agreements, and an active Up-C tax structure that may complicate the cleanest form of long-term ownership. Permanent-loss control is the key test: a multi-quarter customer default or a sustained throughput decline combined with a refinancing event could impair the equity materially, because the debt claim sits in front of common holders on the capital stack. On the dated price, the equity does not yet offer a sufficient margin of safety against that permanent-loss path.
Risks, Disconfirming Evidence, and What Would Prove This Thesis Wrong
The first observable thesis breaker is a sustained decline in customer drilling and completion activity that compresses throughput below MVC levels across multiple basins, which would reduce both fee revenue and MVC shortfall collections. The 10-K explicitly identifies natural decline in customer production, MVC nonpayment, and competitive pressure on contracts as principal risks. The second breaker is a credit event or interest-rate shock that raises the cost of refinancing the $350 million New Permian Transmission Facility or the $825 million of fixed-rate debt; a hypothetical 1% rate rise on variable-rate debt would have added approximately $1.8 million of interest expense in the first half of 2026. The third breaker is a regulatory or environmental enforcement event, including ongoing obligations under the Global Settlement tied to the 2015 Blacktail Release, that imposes additional capital or operating expense beyond the $36.3 million already booked.
The most likely wrong assumption in any constructive read of Summit is that the recent revenue and operating cash flow growth rates of 10.6% and 18.1% are sustainable rather than reflecting a recovery from a prior trough; the filings do not provide enough context to label the current margin as mid-cycle versus peak. Evidence that would force a conclusion change includes the disclosure of a material new MVC contract with creditworthy counterparties, a sustained reduction in net debt through asset divestitures or accelerated cash generation, a meaningful cut in the Up-C tax dilution drag, or a sharp correction in equity price that brings the dated market capitalization inside the deterministic scenario range.
Investment Conclusion
On the dated market snapshot, the equity does not offer a margin of safety, and the valuation analysis work confirms that the dated market capitalization sits well above the range produced by any of the three deterministic scenarios. The conclusion is Overvalued, with the caveat that the equity is at least Worth watching rather than Avoid pending better evidence: the operating assets are real, the wellhead moat is genuine, and the refinancing steps taken in 2026 have reduced structural complexity. Until leverage eases, customer concentration narrows, or the share price corrects, however, the dated price asks the buyer to underwrite a level of free-cash-flow normalization and balance-sheet improvement that the filings do not yet demonstrate. Educational use only; this analysis is not investment advice.
Share this article