The investment case — and what could go wrong
- Gross margin expanded by roughly 970 basis points to 59.8%, but only because the company recognized $7.7 million of IEEPA tariff refunds in cost of goods sold, with $0.3 million more deferred to the next quarter.
- Customer concentration risk is diffuse for Direct revenue, while Indirect relies on roughly 1,200 specialty locations plus department-store and national-account customers, a group whose retreat drove the 39.4% segment decline.
- Where the issuer reports cash flow and capital expenditure cumulatively, the standalone-quarter cash-flow figures are derived by subtracting the preceding cumulative filing.
Selected from this article · 2026-09-16
Read on for the full pictureThe Quarter in Context

For the thirteen weeks ended August 1, 2026, Vera Bradley posted net revenues of $71.6 million, up 1.1% from a year earlier. The Direct segment grew 8.0% on a 9.2% comparable-sales gain, while the Indirect segment shrank 39.4% as the company shifted its marketplace strategy. Gross margin expanded by roughly 970 basis points to 59.8%, but only because the company recognized $7.7 million of IEEPA tariff refunds in cost of goods sold, with $0.3 million more deferred to the next quarter. Reported operating income from continuing operations flipped from a $4.6 million loss to a $4.2 million gain, and net income from continuing operations reached $4.5 million. These results follow a year in which the company divested Pura Vida, recorded a $15.2 million loss on that sale, and suffered deep operating losses tied to inventory cleanups and severance. Cash and equivalents nearly doubled to $34.2 million, and the revolving credit line remained undrawn with $54.3 million of availability.
The quarter therefore looks like an inflection on the surface, but a large share of the swing came from non-recurring items: tariff refunds, a sharp advertising pullback ($4.0 million reduction quarter over quarter), and easier prior-year comparisons. Year-to-date continuing operations still show a small net loss, and fiscal 2025 ended with a substantial reported loss before the discontinued-operations adjustment. The latest quarter is best read as evidence that the cash machine still runs, not as proof that the brand reset has restored durable profitability.
Business Model and Profit Engine
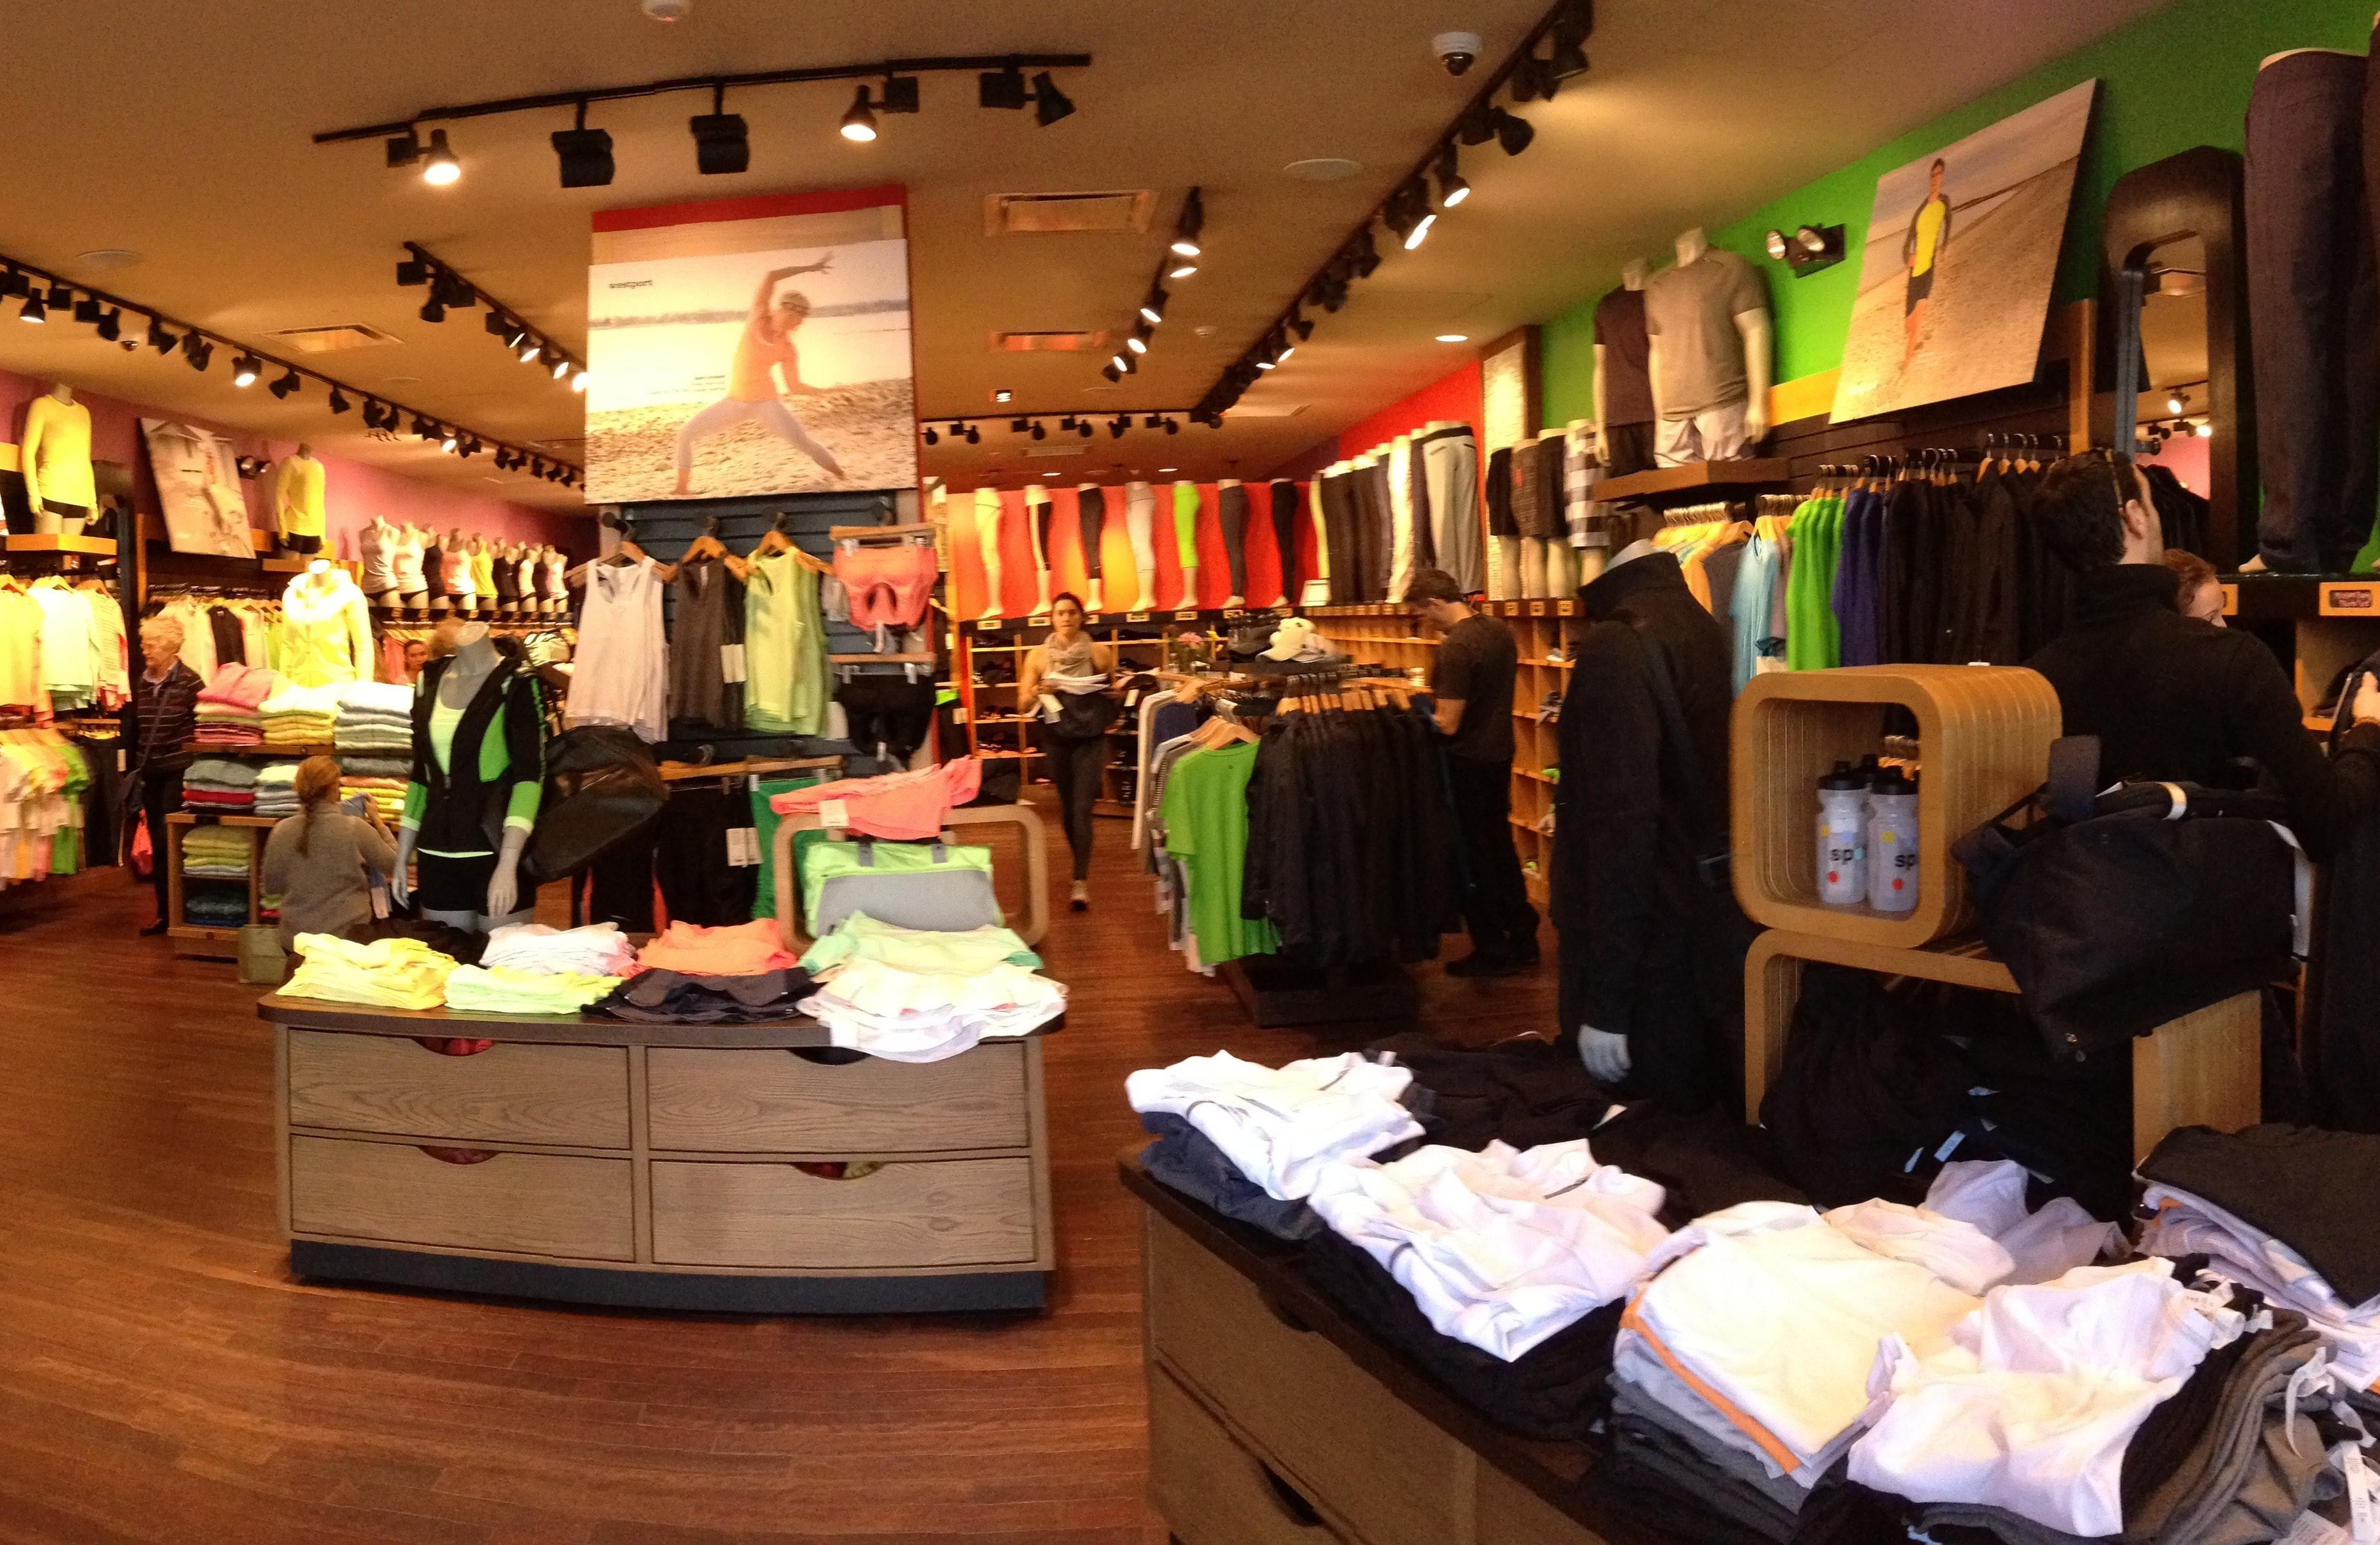
Vera Bradley sells patterned handbags, travel items, accessories, and licensed gift products under a single brand identity that dates to 1982. Two segments carry that revenue: the Direct segment, which operates 26 full-line stores and 86 outlet stores plus the verabradley.com websites and marketplace storefronts, and the Indirect segment, which sells Vera Bradley-branded merchandise to roughly 1,200 specialty retailers and key accounts and collects royalties on the brand. In the latest quarter Direct generated $65.4 million (about 91% of revenue) and Indirect generated $6.3 million (about 9%). Across the continuing business the product mix is dominated by bags (about 51% of the latest quarter) and travel (about 23%), with accessories, home, and apparel filling the remainder.
Revenue becomes gross profit through a sourcing-and-distribution model that the company runs on Asia-sourced product moved through its own retail, wholesale, and e-commerce channels. Gross margin in the latest quarter was 59.8%, a step-function above the prior-year 50.1%, and management attributes the swing primarily to the tariff refund and to favorable sales mix. Operating costs are dominated by selling, general, and administrative expense, which was $38.7 million or 54.1% of revenue in the quarter, down from 57.1% a year ago as advertising was cut sharply. Lease commitments remain meaningful: 112 stores at quarter end and a weighted-average remaining lease term of 4.3 years frame a fixed-cost base that supports operating leverage when revenue grows. The latest quarter operating income of $4.2 million equals a 5.8% operating margin, which is materially better than the year-ago quarter's negative margin but still modest relative to the gross-margin gain, implying that fixed SG&A absorbs most of the variable savings.
Capital intensity is low. Property, plant, and equipment net is $44.3 million on the August 2026 balance sheet, and year-to-date capital expenditure was only $1.0 million against $17.7 million of operating cash flow. The working-capital cycle carries the typical apparel signature: $69.3 million of inventory and $12.8 million of accounts receivable funded by $14.9 million of accounts payable, with seasonal swings visible in the inventory and payables lines. Inventory actually shrank by $6.7 million during the half, a meaningful working-capital tailwind that may not repeat. Pricing power is plausible at the brand level but unproven across the cycle; management cited "Project Sunshine" as a multi-year effort to reposition the assortment, which suggests pricing power is being rebuilt rather than harvested. Customer concentration risk is diffuse for Direct revenue, while Indirect relies on roughly 1,200 specialty locations plus department-store and national-account customers, a group whose retreat drove the 39.4% segment decline.
Earnings Quality and Cash Conversion
Where the issuer reports cash flow and capital expenditure cumulatively, the standalone-quarter cash-flow figures are derived by subtracting the preceding cumulative filing. They are calculations from SEC facts rather than separately reported quarterly line items. Reported earnings quality is weak in the latest quarter and stronger year to date. The 59.8% gross margin includes a $7.7 million IEEPA tariff refund that management does not expect to recur; the 5.8% operating margin was lifted further by a roughly $4.0 million sequential advertising cut that has been characterized as a phased optimization rather than a permanent step-down. Year to date, continuing operations remain at a $(0.3) million net loss, and the prior fiscal year ended with a net loss that included a $15.2 million loss on the sale of Pura Vida, plus severance and inventory cleanups tied to the divestiture.
Cash conversion, by contrast, is the genuine bright spot. Operating cash flow for the twenty-six weeks ended August 1, 2026 was $17.7 million, a $41.0 million swing from the prior-year period's $(23.3) million. The improvement reflects a smaller reported loss, a $6.7 million source of cash from inventory, and a $4.3 million source of cash from accounts receivable, partly offset by a $1.7 million use of cash for payables and an $11.2 million use of cash for operating lease liabilities. Capital expenditure was only $1.0 million, so subtracting it from operating cash flow leaves $16.7 million of derived free cash flow for the half, with the latest quarter alone contributing about $22.3 million of derived free cash flow after the $0.7 million of capex embedded in that period. The filing does not separate maintenance from growth capex, so this number is an accounting free-cash-flow proxy rather than a maintenance-capex owner-earnings figure.
Business Quality, Moat, and Industry Position
On the available evidence, the company is best described as an ordinary participant, not a demonstrated core supply-chain bottleneck. This classification describes strategic position only; it is not independent proof of a moat or valuation upside. The brand has a 40-year history and a recognizable cotton-quilted identity, but the filings do not provide external evidence of pricing power, customer loyalty metrics, or share data that would confirm a durable economic moat. The company itself frames Project Sunshine as a multi-pillar reset, indicating that the historical brand equity is not, on its own, currently producing acceptable financial results. Competitive intensity in women's handbags and accessories is high, with Vera Bradley competing against designer brands, mass-market peers, and direct-to-consumer disruptors; no filings in the available SEC data provide external market-share data, so any claim of moat must be qualified by that gap.
The strongest operational evidence of competitive position is the segment economics: Direct segment operating margin was 25.5% in the latest quarter (vs. 15.4% a year ago) and Indirect segment operating margin was 47.5% (vs. 21.2%). These margins benefit from the tariff refund allocation and from SG&A leverage, so they should not be extrapolated. Direct comparable store sales rose 4.1% with e-commerce up 16.2%, suggesting the omnichannel push and the IP-licensed collections (Disney, Peanuts) are landing with consumers. The Indirect segment decline of 39.4%, driven by a marketplace strategy shift, is a more troubling signal that the brand's pull-through at specialty wholesale is weakening. Observed conditions that would weaken the profit engine include: a return of tariff cost without an offsetting refund, a reversal of the advertising savings if sales growth stalls, continued Indirect-segment attrition, and any new inventory write-downs like those absorbed in the prior year.
Management and Capital Allocation
The senior team is led by Ian Bickley (CEO and Executive Chairman, hired in March 2026) and Martin Layding (Chief Operating and Financial Officer). The departure of a long-tenured CFO and CEO change in fiscal 2026 represents meaningful transition risk that the filings acknowledge indirectly through the severance and restructuring charges of the prior year. The 2024 Share Repurchase Program of up to $30.0 million was authorized in December 2024 and expires in December 2027, but no purchases were made in fiscal 2026 or in the first half of fiscal 2027, and management states it "does not currently plan to purchase under the 2024 Share Repurchase Program".
The asset-based revolving credit facility was amended in October 2025 to permit sale-leaseback transactions and additional asset dispositions, and the filing notes that the company owns two unencumbered real-estate properties, signals that management is preserving liquidity optionality rather than deploying capital aggressively. The company has paid no dividends in the periods shown, has repurchased no shares in fiscal 2026, and is instead rebuilding a cash position that has roughly doubled year to date. Stock-based compensation in the twenty-six weeks was $2.7 million, modest in absolute terms but a recurring non-cash claim against reported income. On balance, capital allocation looks conservative and aligned with the operational reset, but there is no observable per-share value creation yet from repurchases or dividends.
Valuation and What the Market Already Expects
The dated share price is $4.09 and the dated market capitalization is $116.3 million as of September 16, 2026. A simple annualized first-half free-cash-flow yield on the dated market cap is meaningful because the first half already generated about $16.7 million of derived free cash flow and the company ended the period with $34.2 million of cash and zero drawn revolver debt. The dated price implies the market is paying roughly seven times the first-half derived free cash flow on an annualized basis, before working-capital normalization and before any credit for Indirect-segment stabilization. This valuation burden is light in absolute terms but is dependent on a continuation of the working-capital tailwinds and the absence of further one-time charges.
Ten-Year Cash Flow to Fair Market Value
The starting free cash flow is the normalized SEC cash-flow proxy, while every growth rate, discount rate and terminal rate below is an explicit editorial assumption rather than company guidance. Each annual cash flow is forecast and discounted separately; terminal value is year-ten free cash flow multiplied by one plus terminal growth, divided by discount rate minus terminal growth, and then discounted back ten years. Fair market capitalization equals that explicit ten-year present value plus discounted terminal value and a same-date balance-sheet adjustment when available. If current cash and debt facts do not share one report date, the table shows the adjustment as unavailable and conservatively applies zero. The share count is derived from the dated market capitalization and share price so US shares and foreign ADRs use a consistent traded-security denominator.
Year | Bear FCF | Base FCF | Bull FCF |
|---|---|---|---|
1 | $28.7M | $30.5M | $32.3M |
2 | $28.2M | $31.7M | $35.5M |
3 | $27.6M | $33M | $39M |
4 | $27.1M | $34.3M | $42.9M |
5 | $26.5M | $35.7M | $47.2M |
6 | $26.9M | $36.8M | $49.6M |
7 | $27.2M | $37.9M | $52.1M |
8 | $27.6M | $39M | $54.7M |
9 | $28M | $40.2M | $57.4M |
10 | $28.3M | $41.4M | $60.3M |
Scenario | Growth years 1–5 / 6–10 | Discount | Terminal | 10-year PV | Terminal PV | Balance-sheet adjustment | Fair market cap | Fair value/share | Margin of safety | Terminal share |
|---|---|---|---|---|---|---|---|---|---|---|
Bear | -2.0% / 1.3% | 11.0% | 2.0% | $163M | $113M | N/A (treated as $0) | $276M | $9.7 | 57.8% | 41.0% |
Base | 4.0% / 3.0% | 9.0% | 3.0% | $226M | $300M | N/A (treated as $0) | $526M | $18.5 | 77.9% | 57.1% |
Bull | 10.0% / 5.0% | 8.5% | 3.5% | $295M | $552M | N/A (treated as $0) | $847M | $29.8 | 86.3% | 65.1% |
The current market capitalization falls outside the model's -10% to 40% ten-year reverse-DCF search range. This is a sensitivity framework, not a price target: the terminal-value share shows how strongly each result depends on assumptions beyond the explicit forecast. Negative margin of safety means the current market capitalization exceeds the scenario value.
Five Value-Investing Lenses
Benjamin Graham Lens
The balance sheet is resilient: $34.2 million of cash against zero drawn revolver debt, $132.3 million of stockholders' equity, and $239.3 million of total assets versus $106.9 million of total liabilities at quarter end. A brand-name company selling at a low price is not automatically cheap, however, and the prior year ended with a sizeable reported loss driven by the Pura Vida divestiture and restructuring. Graham's test is whether the price provides margin of safety relative to a conservatively normalized earning power, not whether it looks low after a drawdown. Normalized earning power is the unresolved question here, and the dated price implies the market expects a meaningful operating recovery.
Benjamin Franklin Lens
Franklin's modern lesson is thrift, discipline, and the avoidance of waste. Vera Bradley's first half reduced advertising by $4.0 million quarter over quarter and cut unallocated expenses, demonstrating cost discipline. The opportunity cost is that the company is choosing to reinvest in the brand reset rather than buy back stock at a depressed price, even though the 2024 Share Repurchase Program remains authorized and unused. Capital preservation is reasonable when management believes intrinsic value is being rebuilt, but it becomes expensive if the brand reset fails to restore unit economics.
Warren Buffett Lens
The owner-economics lens asks what the business throws off to its owners. Trailing twelve months generated $31.0 million of operating cash flow against only $1.7 million of capex, so the accounting free-cash-flow proxy is roughly $29.3 million, and the company ended the period with $34.2 million of cash and zero drawn debt. Subtracting current debt is a no-op because none is drawn; the dated market cap is well below the base scenario value. The capital-allocation record is conservative but not yet rewarding: no buybacks in fiscal 2026, no dividend, and a brand reset that is still showing a year-to-date net loss.
Charlie Munger Lens
Munger would invert the bull case: a brand reset that requires cutting advertising to restore profitability is fragile, the 39.4% Indirect-segment decline signals channel erosion rather than a clean reset, and the gross-margin gain is non-recurring tariff income. The incentive question is whether management's reset is value-creating or self-serving; the absence of share repurchases at a low price is at least consistent with value preservation but cannot be confirmed without seeing per-share intrinsic-value improvement. The most likely wrong assumption is that the $7.7 million tariff refund and the advertising cuts can be sustained indefinitely while the brand rebuilds traffic. If comparable sales stall in fiscal 2027 without the one-time tailwinds, the operating margin reverts toward break-even.
Li Lu Lens
The circle-of-competence question is whether an investor can underwrite a single-brand consumer-discretionary turnaround in a fragmented handbag market, where the filings offer no external market-share or customer-survey evidence. Culture is observable only through conduct: aggressive cost cuts, a new CEO, a credit-facility amendment that loosens asset-disposition limits, and a multi-pillar strategic reset named in marketing language. Durable-advantage evidence is thin; the brand is recognizable but the financials do not yet demonstrate pricing power or repeat-purchase economics. Permanent-loss risk is best framed as a multi-year value trap if Indirect erosion spreads to Direct and the brand reset fails.
Risks, Disconfirming Evidence, and What Would Prove This Thesis Wrong
Three observable thesis breakers stand out. First, a reversal of the $7.7 million tariff refund and $4.0 million sequential advertising cut would leave year-to-date operating profit close to break-even, so a return to gross-margin compression in the back half of fiscal 2027 would directly undermine the cash-flow story. Second, continued Indirect-segment decline, especially a deeper drop than the 39.4% already reported, would indicate that wholesale channel pull-through is structurally weaker than the brand reset assumes. Third, a working-capital reversal—rising inventory or rising receivables—would convert the $17.7 million year-to-date operating cash flow back toward the prior-year's $(23.3) million, removing the principal valuation argument. The purchase-price-adjustment dispute with the Creative Genius buyer (a roughly $4.6 million claim that the company disputes) is a smaller but real legal overhang.
Investment Conclusion
The dated market price of $4.09 and the dated market capitalization of $116.3 million imply a valuation burden that is light relative to the deterministic base scenario but only if the first-half operating cash flow normalizes without the tariff refund and without further SG&A cuts. Cash generation is real, balance-sheet protection is real, and the dated price sits well below the deterministic base scenario value, but the quality of reported earnings is weak and the brand reset is still in progress. The shares appear worth watching with a bias toward valuation support, conditional on evidence that the back half of fiscal 2027 sustains the cash flow without one-time benefits.
This article is for educational and informational purposes only and is not investment advice. Investors should perform their own due diligence and consult professional advisors before making any investment decisions.
Share this article