The investment case — and what could go wrong
- The operating improvement was broad: gross margin reached 49.2% from 46.3%, while R&D and SG&A declined as percentages of sales despite increasing in dollars.
- The filing describes one reportable segment, so product- and market-level revenue is available but segment contribution is not.
- Share issuance under employee plans and equity-award settlement dilute per-share ownership, so capital allocation succeeds only if operating returns exceed both the cost of capital and dilution.
Selected from this article · 2026-10-31
Read on for the full pictureThe Quarter in Context
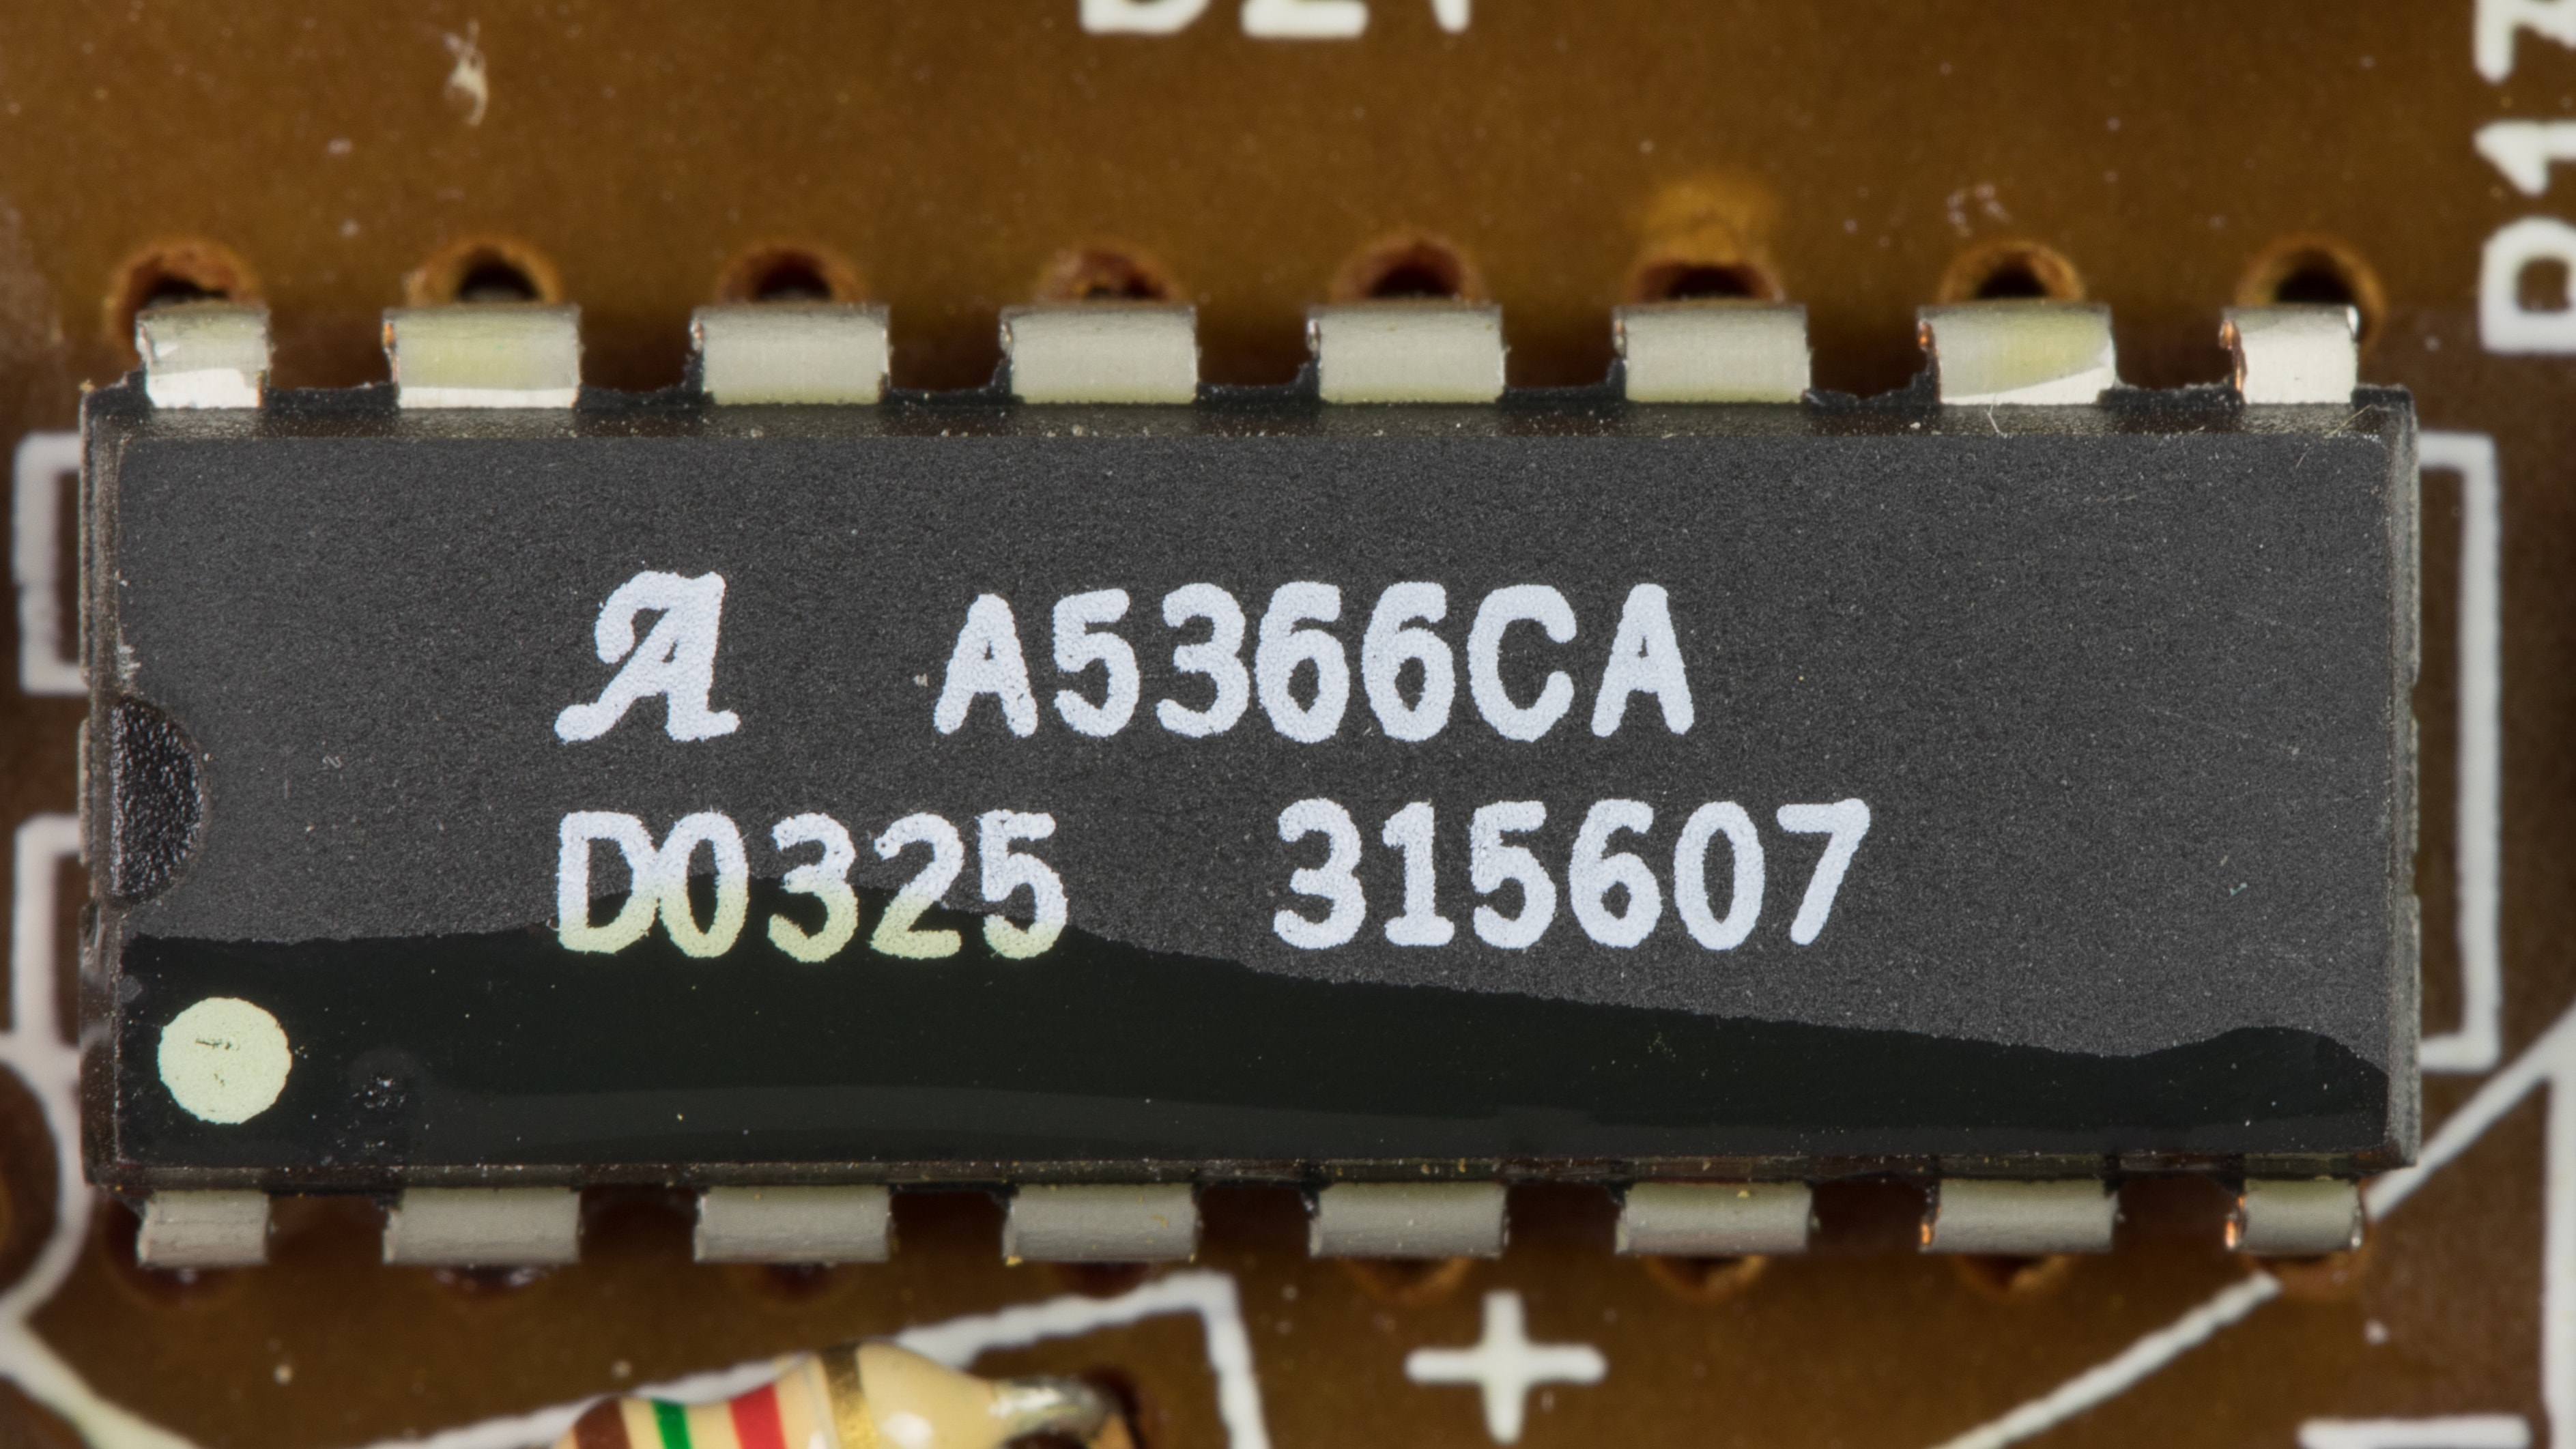
Allegro MicroSystems’ second quarter of fiscal 2027, the 13 weeks ended September 25, 2026, showed a marked recovery from the comparable quarter ended September 26, 2025. Net sales rose 29.2% to $276.9 million, gross profit increased 37.1% to $136.2 million, and operating income reached $35.4 million versus $6.2 million. Net income attributable to Allegro was $23.3 million, or $0.12 per diluted share, versus $6.5 million, or $0.03 per diluted share.
The operating improvement was broad: gross margin reached 49.2% from 46.3%, while R&D and SG&A declined as percentages of sales despite increasing in dollars. Industrial and Other sales grew especially strongly, rising to $104.4 million from $58.4 million, while Automotive sales increased to $172.5 million from $155.8 million. By product, magnetic sensors contributed $158.0 million of sales and power integrated circuits contributed $118.9 million.
This is an entry point, not a completed valuation history. The company describes itself as cyclical, and the quarter benefited from higher sales, favorable product mix, and improved manufacturing absorption. It therefore cannot be annualized as a steady-state result. The central issue is whether the recent recovery reflects durable earning power and mid-cycle cash generation, or whether the market price capitalizes a favorable point in the cycle too aggressively.
Business Model and Profit Engine
Allegro sells sensor integrated circuits and application-specific power integrated circuits to customers designing automotive, industrial, data-center, robotics, energy-infrastructure, consumer, and other electromechanical systems. Customers buy sensing, motion control, motor control, power conversion, and power-management functions that improve efficiency, precision, safety, and reliability. The company says it ships approximately 2.1 billion units annually to more than 15,000 customers worldwide.
The filing describes one reportable segment, so product- and market-level revenue is available but segment contribution is not. For the quarter ended September 25, 2026, Automotive generated $172.5 million of sales, Industrial and Other $104.4 million, magnetic sensors $158.0 million, and power integrated circuits $118.9 million. The company sells through distribution relationships, and one distributor represented 12.9% of quarterly sales; no customer or distributor represented at least 10% of outstanding trade receivables. The filing does not disclose distributor inventory, customer cohorts, recurring-versus-transactional revenue, or product-level margins, so the durability of each revenue engine cannot be isolated fully.
Revenue becomes gross profit by subtracting manufacturing and product costs, then operating profit by deducting R&D and SG&A. Cost of goods sold is partly variable with volume, manufacturing inputs, and mix, while R&D, much SG&A, and depreciation are comparatively fixed. That creates operating leverage: in the latest quarter, sales growth outpaced operating-expense growth, lifting operating margin to 12.8% from 2.9%. Yet fixed manufacturing assets and inventory also mean weak demand can reverse that leverage through under-absorption.
Allegro is capital intensive because it manufactures through third-party wafer fabrication and assembly/test providers and depends on manufacturing operations in the Philippines. Its own property, plant and equipment was $300.7 million at September 25, 2026, while inventory was $181.6 million, including $137.4 million of work in process. Capital expenditures are not separated into maintenance and growth, so the portion required merely to sustain capacity cannot be measured.
The profit engine would weaken if product mix or pricing reversed, manufacturing absorption fell, customers reduced inventory, or demand shifted away from higher-growth industrial applications. Returns and sales allowances are material: the obligation against receivables rose to $64.8 million from $48.6 million at March 27, 2026. That does not prove deteriorating economics, but it makes channel and inventory normalization important checks.
Earnings Quality and Cash Conversion
Quarterly cash-flow calculations below subtract two reported cumulative statements. These are author calculations, not directly reported quarterly line items. Amounts are USD.
Metric | Quarter | Cumulative less preceding cumulative | Calculated quarter | Sources |
|---|---|---|---|---|
Operating cash flow | 2026-06-27 to 2026-09-25 | $58,837,000 (2026-09-25) minus ($21,989,000; 2026-06-26) | $36,848,000 | Statements through 2026-09-25 and 2026-06-26 |
Operating cash flow | 2025-06-28 to 2025-09-26 | $81,980,000 (2025-09-26) minus ($61,618,000; 2025-06-27) | $20,362,000 | Statements through 2025-09-26 and 2025-06-27 |
Capital expenditure | 2026-06-27 to 2026-09-25 | $14,360,000 (2026-09-25) minus ($8,017,000; 2026-06-26) | $6,343,000 | Statements through 2026-09-25 and 2026-06-26 |
Capital expenditure | 2025-06-28 to 2025-09-26 | $17,044,000 (2025-09-26) minus ($10,600,000; 2025-06-27) | $6,444,000 | Statements through 2025-09-26 and 2025-06-27 |
Where the issuer reports cash flow and capital expenditure cumulatively, the standalone-quarter cash-flow figures are derived by subtracting the preceding cumulative filing. They are calculations from SEC facts rather than separately reported quarterly line items.
Reported earnings improved sharply. Trailing-twelve-month operating cash flow was $139.9 million and capital expenditure was $35.5 million, producing an accounting free-cash-flow proxy of $104.4 million. This is operating cash flow minus total property, plant and equipment spending; it is not normalized owner earnings because maintenance and growth capital expenditure are not disclosed separately, and stock-based compensation remains a real economic cost to shareholders.
For the September 25, 2026 quarter, both cash-flow values are author calculations from cumulative filings. Operating cash flow was $36.848 million, subtracting six-month cumulative operating cash flow of $58.837 million from the $21.989 million reported for the quarter ended June 26, 2026. Derived capital expenditure was $6.343 million, subtracting six-month cumulative spending of $14.360 million from $8.017 million for the prior quarter. The resulting $30.505 million quarterly accounting free-cash-flow proxy is therefore derived, not a directly reported quarterly line item.
Cash conversion was good in the latest quarter but has a cycle-sensitive comparison. Derived operating cash flow of $36.848 million exceeded the prior-year quarter’s derived $20.362 million, while derived capital expenditure was $6.343 million versus $6.444 million. The six-month statements tell a more nuanced story: operating cash flow fell to $58.8 million from $82.0 million because working-capital and related-party uses offset higher earnings, while capital expenditure declined to $14.4 million from $17.0 million.
Working capital is meaningful. Trade receivables increased to $108.5 million and inventory was essentially unchanged at $181.6 million from March 27, 2026. During the six months, receivables consumed $15.2 million of cash, inventories consumed $2.2 million, and a $20.0 million advance payment to a related party consumed cash. These movements help explain why accounting earnings can differ from operating cash flow even in a profitable quarter.
Stock-based compensation was $14.1 million in the latest quarter and $28.3 million in the first six months. Shares outstanding rose to 186.5 million at September 25, 2026 from 185.4 million at March 27, 2026. The cash-flow statement shows $18.2 million paid for taxes related to net share settlement during the first six months. This is dilution economics even when the mechanical share increase looks modest in a single quarter.
Business Quality, Moat, and Industry Position
Allegro’s strongest moat evidence is technical and customer-facing rather than financial. Its sensor portfolio includes Hall-effect, GMR, and TMR technologies; its power products use proprietary BCD process technology and packaging. The company emphasizes high-temperature operation, high-speed and high-precision signal processing, and compliance with automotive safety and reliability standards. These capabilities can raise qualification barriers because customer designs require reliability, performance, and system-level integration.
The company also describes a broad product portfolio of more than 1,500 products, with sales across many customers and applications. That breadth can reduce dependence on one product, but the available evidence does not establish switching costs, design-win duration, or customer retention quantitatively. Sanken owned approximately 32.2% of the company at March 27, 2026, which is relevant both to ownership concentration and to the prior leveraged repurchase transaction.
Allegro participates in an enabling position upstream of finished electronic systems: its chips are designed into customer products and support automotive and industrial end demand. Direct customers include distributors, but the company does not disclose their identities, sell-through, inventory, or end-customer cohorts. Thus, order visibility and channel health remain important gaps.
The supply-chain bottleneck is better characterized as an important participant than a proven core bottleneck. Allegro’s specialized sensors, power products, intellectual property, process technology, and customer qualifications may create differentiated value capture. However, the company relies on a limited number of third-party wafer fabrication facilities and suppliers, manufacturing yield and capacity can constrain output, and competitors or alternative architectures may substitute for individual products. With no customer- or competitor-level evidence available, the bottleneck score is 2 out of 5.
Management and Capital Allocation
Management’s observable conduct includes investing in a broad product portfolio and R&D while using cash and revolver capacity for growth initiatives, planned capital expenditure, and potential acquisitions. It also manages a global manufacturing footprint and continues regional expansion, including China, Europe, Japan, and India. These are strategic intentions, not proof of returns on invested capital.
The historical Sanken repurchase deserves caution. In July and August 2024, Allegro issued 28.75 million shares at $24.00 per share and used the proceeds plus debt to repurchase 38.77 million shares from Sanken. Shares issued and repurchased were retired, but the second closing used term-loan proceeds and existing cash. This reduced the share count but did not avoid balance-sheet leverage. The transaction also illustrates that per-share engineering and financing choices must be judged together.
At September 25, 2026, current and noncurrent debt totaled $287.155 million, while cash and cash equivalents were $193.039 million, producing net debt of $94.116 million. The debt components total $5.821 million more than the separately reported long-term aggregate of $281.334 million; the filing evidence does not explain that difference, so the component-based total is used consistently. Short-term borrowings were not separately available and must not be treated as zero.
No common dividend is supported by the current evidence, and the latest repurchase fact is not evidence of current buybacks. Share issuance under employee plans and equity-award settlement dilute per-share ownership, so capital allocation succeeds only if operating returns exceed both the cost of capital and dilution. No acquisition-return evidence or segment-level return analysis is available.
Valuation and What the Market Already Expects
At the October 31, 2026 market close, ALGM traded at $33.03 and had a market capitalization of $6.157 billion. The market capitalization already represents equity value; enterprise value is therefore higher after adding the $94.116 million net-debt adjustment.
Against trailing-twelve-month accounting free-cash-flow proxy of $104.434 million, the equity cash-flow yield is only about 1.7% before considering that this proxy may reflect a favorable point in the cycle and does not isolate maintenance capital expenditure. That low yield indicates a demanding valuation, not necessarily an incorrect price: the market could be paying for sustained growth in sales, margins, and cash generation.
The valuation burden is especially important because the latest quarter benefited from favorable product mix and manufacturing absorption. A mid-cycle case should require evidence of stable pricing, normalized customer inventory, adequate utilization, and cash flow after maintenance investment. No complete historical cycle, maintenance-capex split, product-level margin, or customer cohort data is available, so the cash-flow base cannot responsibly be described as a conservative mid-cycle trough.
Qualitatively, the dated market price appears to require substantial operating normalization: sustained double-digit growth, durable margin improvement, and continued cash expansion. The burden increases if industrial and other demand normalizes, automotive growth slows, or incremental capital expenditure absorbs more operating cash. A lower price would improve protection, but price alone is not thesis evidence.
Ten-Year Cash Flow to Fair Market Value
The starting free cash flow is the normalized SEC cash-flow proxy, while every growth rate, discount rate and terminal rate below is an explicit editorial assumption rather than company guidance. Each annual cash flow is forecast and discounted separately; terminal value is year-ten free cash flow multiplied by one plus terminal growth, divided by discount rate minus terminal growth, and then discounted back ten years. Fair market capitalization equals that explicit ten-year present value plus discounted terminal value and a same-date balance-sheet adjustment when available. If current cash and debt facts do not share one report date, the table shows the adjustment as unavailable and conservatively applies zero. The share count is derived from the dated market capitalization and share price so US shares and foreign ADRs use a consistent traded-security denominator.
Year | Bear FCF | Base FCF | Bull FCF |
|---|---|---|---|
1 | $110M | $117M | $123M |
2 | $117M | $130M | $145M |
3 | $123M | $145M | $170M |
4 | $130M | $162M | $200M |
5 | $138M | $181M | $236M |
6 | $142M | $192M | $254M |
7 | $146M | $203M | $273M |
8 | $150M | $215M | $294M |
9 | $155M | $228M | $316M |
10 | $160M | $241M | $340M |
Scenario | Growth years 1–5 / 6–10 | Discount | Terminal | 10-year PV | Terminal PV | Balance-sheet adjustment | Fair market cap | Fair value/share | Margin of safety | Terminal share |
|---|---|---|---|---|---|---|---|---|---|---|
Bear | 5.7% / 3.0% | 11.0% | 2.0% | $0.78B | $0.637B | -$0.0941B | $1.32B | $7.1 | -365.4% | 45.0% |
Base | 11.7% / 5.8% | 9.0% | 3.0% | $1.1B | $1.75B | -$0.0941B | $2.76B | $14.8 | -123.4% | 61.3% |
Bull | 17.7% / 7.6% | 8.5% | 3.5% | $1.44B | $3.11B | -$0.0941B | $4.45B | $23.9 | -38.3% | 68.4% |
In the reverse-DCF, holding the 9% discount rate and 3% terminal growth fixed, and solving only for one constant growth rate rather than using the base-case growth path, the current market capitalization implies roughly 19.4% annual free cash flow growth for ten years. This is a sensitivity framework, not a price target: the terminal-value share shows how strongly each result depends on assumptions beyond the explicit forecast. For positive scenario equity values, negative margin of safety means the current market capitalization exceeds the scenario value. For zero or negative scenario equity values, a margin-of-safety percentage is not meaningful; the obligations exhaust the modeled enterprise value.
Five Value-Investing Lenses
Benjamin Graham Lens
The September 25, 2026 balance sheet offers some protection: cash was $193.0 million, working capital was $425.1 million, and equity was $1.004 billion against $287.2 million of selected debt. Yet the company also has net debt, cyclical earnings, and inventory exposure. The October 31, 2026 market capitalization is many times current earnings and cash generation, leaving little conventional downside protection. This is an operating recovery with balance-sheet support, not a Graham-style bargain. The key floor test is whether cash and profitable normalized operations can withstand a downturn without distressed financing; the available evidence does not establish that floor at the current price.
Benjamin Franklin Lens
Franklin’s modern lesson is disciplined capital use and opportunity cost. Allegro can reinvest in R&D, manufacturing capacity, regional expansion, and acquisitions, but the filing does not disclose incremental returns on those investments. The company also funded a major historical repurchase partly with debt. Thrift should therefore mean preserving balance-sheet flexibility and buying assets only when expected returns exceed the cost of capital. At a 1.7% equity cash-flow yield on the dated accounting proxy, the opportunity cost of committing capital to ALGM is substantial. The practical question is not whether Allegro can spend, but whether each dollar creates more per-share value than debt repayment, dividends, or less demanding opportunities.
Warren Buffett Lens
Owner economics require more than the $104.434 million trailing operating-cash-flow-minus-capex proxy. Total capex includes both maintenance and growth spending, so a conservative owner-earnings measure would first subtract recurring capital needed to preserve capacity, which is unavailable here. Stock-based compensation also represents a cost to owners and should not be treated as free. The $30.505 million latest-quarter proxy, although derived from cumulative filings, supports improving cash conversion. The moat evidence—specialized sensors, packaging, process technology, and qualification—can support persistence, but pricing power and customer switching costs are not quantified. Capital allocation is mixed: product investment is sensible, while the debt-funded repurchase history deserves scrutiny.
Charlie Munger Lens
The strongest incentive check is the gap between accounting profit and shareholder cash. The latest quarter earned $23.3 million, yet stock-based compensation was $14.1 million and shares outstanding increased during the first six months. Employee equity can align talent with long-term value, but shareholders need evidence that compensation is offset by per-share economic gains rather than merely tolerated.
Inversion is equally important: the investment can fail if the apparent demand surge is a pull-forward, if favorable mix reverses, or if factories require more capital as sales slow. The most likely wrong assumption is that the Q2 FY2027 margin structure represents normalized economics. A headline-driven investor may also anchor on 29.2% revenue growth and overlook the lower six-month operating cash flow. The thesis should change if revenue growth contracts while gross margin and working-capital conversion deteriorate together.
Li Lu Lens
Allegro sits within a understandable circle of competence: specialized analog and mixed-signal semiconductors serving safety- and performance-sensitive applications. The culture question is harder. Observable conduct includes continued R&D, manufacturing investment, restructuring, regional expansion, and a complicated related-party history involving Sanken and Polar Semiconductor. The disclosures are formal and include meaningful related-party detail, but they do not reveal how management evaluates new investments or whether capital is allocated to the highest-return opportunities.
Durability may rest on application knowledge, qualification, and intellectual property rather than a single product. The principal permanent-loss risk is not merely one weak quarter but a sequence of product displacement, manufacturing disruption, and overinvestment that permanently impairs returns on capital. The available evidence supports following the company closely, not assuming culture will guarantee a moat or that current growth is permanent.
Risks, Disconfirming Evidence, and What Would Prove This Thesis Wrong
The operating thesis has at least four observable breakers. First, gross margin could fall materially from 49.2% as product mix or manufacturing absorption normalizes. Second, revenue growth could slow sharply after the industrial and power-product increase, particularly if distributor or customer inventories are corrected. Third, operating cash flow could weaken while receivables and inventory rise faster than sales. Fourth, capital expenditure could accelerate without corresponding revenue or operating-profit growth, reducing free-cash-flow conversion.
The most likely wrong assumption is that the September 25, 2026 quarter’s margin and growth mix is sustainable. Other important risks include reliance on a limited number of external wafer fabrication facilities, manufacturing concentration in the Philippines, distributor concentration, cyclical automotive and industrial demand, product and customer concentration, inventory commitments, currency exposure, and the company’s debt. The Polar Semiconductor investment also produced a $6.6 million loss in the first six months, and the company had advanced $20.0 million to that related party.
A conclusion change would be required if several quarters show durable revenue growth, stable gross margin near recent levels, and cash generation after capex that materially exceeds the current proxy without a corresponding increase in working-capital intensity or dilution. The conclusion would become more bearish if revenue contracts, gross margin reverses, inventory and receivables build, or operating cash flow remains below net income for sustained periods. The dated valuation already leaves limited room for those disappointments.
Investment Conclusion
Allegro deserves continued study because its September 25, 2026 quarter demonstrated a meaningful operating recovery, specialized semiconductor technology, broad applications, and improved cash generation. Its historical loss history makes a single quarter unreliable, however, and the lack of product margins, customer cohorts, channel inventory, and maintenance-capex disclosure limits confidence in normalized economics.
The October 31, 2026 market price is the decisive constraint. The market capitalization materially exceeds the base valuation, while even the favorable scenario does not reach the price. With debt, dilution, supplier dependence, cyclicality, and a demanding cash-flow burden, the current price does not offer a Graham-style margin of safety. The conclusion is Overvalued: an improving company can still be a poor investment at an excessive price. Investors should wait for either a materially lower price or stronger evidence that mid-cycle cash generation, pricing, customer economics, and per-share reinvestment returns can support the valuation burden.
Educational-use disclaimer: This article is for general educational purposes only and is not personalized investment, legal, tax, or accounting advice. It does not account for any reader’s objectives, financial circumstances, or risk tolerance. Readers should independently examine the company’s filings and consult qualified advisers before making investment decisions.
This article is for research and educational purposes and does not constitute personalized investment advice.
Share this article