The Quarter in Context

For the three months ended June 30, 2026, Astec Industries reported revenue of $408.1 million, up roughly 23.6% from $330.3 million in the prior-year quarter. The increase was driven by the July 2025 acquisition of TerraSource and the January 2026 acquisition of CWMF; organic growth and favorable pricing also contributed. Backlog of $601.1 million was 57.9% higher than a year earlier, suggesting visibility into the second half of 2026.
Despite the revenue gain, GAAP operating income was essentially flat at $20.4 million versus $21.4 million, because selling, general and administrative expenses expanded 27.6% to $85.5 million on intangible amortization, personnel, exhibit costs and dealer commissions. Interest expense of $7.1 million was more than triple the prior-year quarter's $2.1 million, reflecting the 2025 credit facility that funded the acquisitions. Net income of $10.5 million and diluted EPS of $0.45 mark a step down from $16.7 million and $0.72 a year earlier.
Business Model and Profit Engine
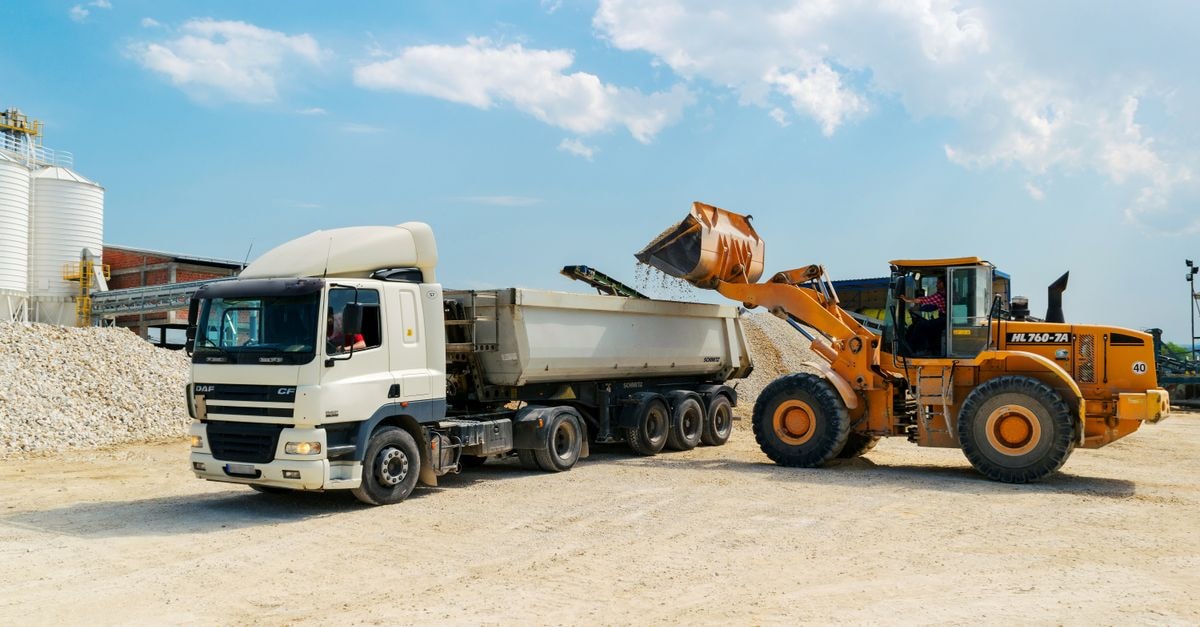
Astec designs, engineers, manufactures and services equipment and components used primarily in asphalt and concrete road building and in related construction activities, and also makes material-handling and processing equipment for adjacent end markets. The customer base spans asphalt and concrete producers, highway and heavy contractors, mine and quarry operators, recycling contractors, port and inland terminals, and government agencies, with a meaningful recurring stream from replacement parts and aftermarket service. Revenue is recognized as performance obligations are satisfied under ASC 606 for both equipment and parts or service arrangements.
The principal revenue engines are two reportable segments. In Q2 2026, Infrastructure Solutions generated $228.3 million (+11.6% year over year), with domestic equipment sales and parts revenue rising while international sales declined. Materials Solutions generated $179.8 million (+43.0% year over year), with the TerraSource acquisition contributing about $40.6 million and parts or service revenue rising sharply. Customers therefore pay either for capital equipment or for the parts and service that keep installed fleets running, which provides a recurring cash anchor on top of a transactional equipment cycle.
Gross profit reached $106.8 million, a 26.2% gross margin, up from 26.7% a year earlier. Operating leverage from higher volumes was largely consumed by SG&A growth, so operating margin compressed to about 5.0% in Q2 2026. Fixed costs in manufacturing and SG&A, plus rising intangible amortization from TerraSource and CWMF, make the model sensitive to volume; conversely, an inflection in demand translates meaningfully to operating income because much of the cost base is fixed. Capital intensity is moderate: capital expenditure of $7.4 million in Q2 2026 (derived by subtracting the six-month cumulative figure from the second-quarter cumulative figure in the cash-flow statement) sits well below depreciation and amortization of $28.6 million for the six-month period. Working capital is a meaningful cash sink: inventory of $460.3 million and trade receivables of $219.1 million dwarf $107.6 million of accounts payable, and customer deposits of $73.2 million act as a partial offset. Segment-level operating margin (rather than Segment Operating Adjusted EBITDA), named-customer concentration, and the split between maintenance and growth capital expenditure are not separately disclosed in the filings, which is a data gap.
Observable conditions that would weaken the profit engine include a sharp drop in non-residential or infrastructure construction demand, a sustained surge in steel or component costs that cannot be passed through, higher interest expense that compresses pre-tax income, and continued integration friction from the TerraSource ERP and internal-control rollout.
Earnings Quality and Cash Conversion
Where the issuer reports cash flow and capital expenditure cumulatively, the standalone-quarter cash-flow figures are derived by subtracting the preceding cumulative filing. They are calculations from SEC facts rather than separately reported quarterly line items. Reported Q2 2026 net income of $10.5 million reconciles to roughly $12.1 million of operating cash flow for the quarter (derived by subtracting the six-month cumulative figure from the second-quarter cumulative figure in the cash-flow statement, which matches the quarter figure on the SEC's structured facts). Capital expenditure of $7.4 million leaves an accounting free-cash-flow proxy of about $4.7 million for the quarter, or a 1.2% margin. On a trailing-twelve-month basis the same calculation gives about $32.4 million against revenue of $1,555.1 million, a roughly 2.1% margin. The filings do not separate maintenance from growth capital expenditure, so this proxy cannot be labeled a maintenance-capex owner-earnings figure; it is an accounting subtraction with that limitation.
The gap between accounting earnings and cash is driven by working capital rather than by one-time accounting items. In the six months ended June 30, 2026, inventory released $15.8 million of cash but customer deposits declined $20.9 million and warranty payments outpaced new provisions, leaving operating cash flow of $52.8 million on net income of $11.8 million. The 2025 credit facility pushed interest expense up sharply: six-month interest paid in cash of $12.3 million was more than triple the prior-year $3.4 million, and that amount is a real cash outflow that is included within the operating-activities section of the cash-flow statement through the reconciliation of net income to net cash provided by operating activities; it is not a separate cash-flow line.
Earnings quality is therefore moderate. Reported earnings are not inflated by large non-cash gains, but they do include intangible amortization and acquisition-related inventory step-up charges that lower GAAP profit while leaving cash relatively unaffected. The trail of net income lagging operating cash flow across recent quarters ($10.5 million vs $12.1 million in Q2 2026; $1.3 million net income but $40.7 million of operating cash flow in Q1 2026) suggests underlying cash generation is more stable than headline earnings, but the thin FCF margin still leaves little room for execution missteps.
Business Quality, Moat, and Industry Position
On the available evidence, the company is best described as an important participant in its end markets rather than a demonstrated supply-chain bottleneck. This classification describes strategic position only; it is not independent proof of a moat or valuation upside. Astec operates in a fragmented industry where equipment is engineered for specific end uses (asphalt plants, concrete plants, crushing and screening, chipping and grinding), and customers value reliability, parts availability and service over the life of the machine. Replacement parts and aftermarket service are an integral part of the business, which is the closest thing to a recurring revenue stream in the model. Switching costs are modest but real: fleet owners standardize on a brand to reduce training, parts inventory and downtime risk.
Backlog of $601.1 million, up 57.9% year over year, indicates demand visibility and supports a thesis of orderbook strength. Backlog grew in both segments, with Materials Solutions more than doubling thanks to TerraSource and what management describes as data-center-driven aggregate demand. The data-center demand comment is management narrative, not a filed audited statement; it is a useful color but not direct evidence of structural growth.
Competitive durability is a real but bounded advantage. Astec does not have a single dominant franchise; it competes against other road-building specialists, diversified industrial conglomerates and private regional players. The TerraSource and CWMF acquisitions extend the company into adjacent product categories rather than deepening a single moat, and they introduce integration risk during the multi-year ERP rollout. The most observable moat evidence is the installed base that feeds parts and service revenue, plus a multi-decade brand history; the least observable is any quantitative share figure, which the filings do not provide.
Management and Capital Allocation
Management has been an aggressive capital allocator in the recent period. TerraSource was acquired for $252.6 million in July 2025 and CWMF for $70.1 million in January 2026. According to the filings, TerraSource was financed using net proceeds from the 2025 credit agreement, while CWMF was funded by a combination of incremental borrowings on the Company's credit facilities and cash on hand. The preliminary purchase-price allocations report TerraSource goodwill of $86.3 million and acquired definite-lived intangibles of $127.2 million, and CWMF goodwill of $21.9 million and acquired definite-lived intangibles of $31.1 million. Long-term debt rose to $365.4 million at June 30, 2026 from $319.6 million at year-end 2025. This is leverage-funded growth, and the durability of the thesis depends on integration and synergy realization rather than on organic compounding.
Return-of-capital policies are modest. The company paid a $0.13 per share quarterly dividend in both Q2 2026 and Q2 2025, totaling about $6.0 million in the first six months of 2026, and the SEC facts do not show any share repurchases during the period. Share-based compensation of $2.5 million in the quarter (a derived figure from the structured facts, not a directly reported quarterly line) and $5.1 million for the six-month period is a small dilution lever; the diluted share count grew by roughly 117,000 shares from year-end 2025 to June 30, 2026, mostly from incentive-plan issuance rather than open-market dilution.
Incentive structures tie to ROIC and total shareholder return performance-based restricted stock units under the 2025 Equity Incentive Plan, which aligns management with capital efficiency. Capital allocation discipline is the key variable to watch: the next several quarters should reveal whether TerraSource and CWMF generate cash or simply add amortization and integration cost.
Valuation and What the Market Already Expects
The dated market capitalization was $995.8 million against cash and short-term investments of $78.6 million and total debt of $393.4 million (comprising $16.2 million of current maturities of long-term debt, $11.8 million of short-term debt and $365.4 million of long-term debt), leaving the enterprise value implied by the public market at roughly $1.31 billion before any other adjustments. The dated share price of $43.25 on September 8, 2026 sits well above the deterministic base-case fair value per share implied by the ten-year free-cash-flow exercise, and the base-case fair market value is materially below the dated equity value.
The valuation analysis exercises a range of growth paths. Under the bear scenario, with low single-digit growth and an 11% discount rate, fair market value comes in near the low end of the available range. Under the base scenario, with mid-single-digit growth and a 9% discount rate, fair market value lands meaningfully below the dated equity value. Under the bull scenario, with growth into the low teens and an 8.5% discount rate, fair market value approaches the dated equity value. None of the lower scenarios reaches the dated market capitalization; only the bull case approaches it.
The reverse-DCF implied growth rate embedded in the dated market capitalization is well above the company's observed revenue growth of about 23.6% in Q2 2026, but that observed growth is partly acquisition-driven and partly driven by what management describes as data-center-related aggregate demand. On a longer-term basis, the required growth is demanding because it must be sustained for ten years after normalizing for acquisition contributions and one-time demand tailwinds. With GAAP operating margin of roughly 5.0% in Q2 2026 and FCF margin of about 2.1% on a trailing-twelve-month basis, that required growth path also implies sustained margin expansion that the filings do not directly support.
Ten-Year Cash Flow to Fair Market Value
The starting free cash flow is the normalized SEC cash-flow proxy, while every growth rate, discount rate and terminal rate below is an explicit editorial assumption rather than company guidance. Each annual cash flow is forecast and discounted separately; terminal value is year-ten free cash flow multiplied by one plus terminal growth, divided by discount rate minus terminal growth, and then discounted back ten years. Fair market capitalization equals that explicit ten-year present value plus discounted terminal value and a same-date balance-sheet adjustment when available. If current cash and debt facts do not share one report date, the table shows the adjustment as unavailable and conservatively applies zero. The share count is derived from the dated market capitalization and share price so US shares and foreign ADRs use a consistent traded-security denominator.
Year | Bear FCF | Base FCF | Bull FCF |
|---|---|---|---|
1 | $33.5M | $35.5M | $37.4M |
2 | $34.7M | $38.8M | $43.2M |
3 | $35.8M | $42.4M | $49.8M |
4 | $37.1M | $46.4M | $57.5M |
5 | $38.3M | $50.8M | $66.4M |
6 | $39.5M | $53.2M | $70.4M |
7 | $40.7M | $55.7M | $74.8M |
8 | $41.9M | $58.3M | $79.3M |
9 | $43.1M | $61.1M | $84.2M |
10 | $44.4M | $64M | $89.3M |
Scenario | Growth years 1–5 / 6–10 | Discount | Terminal | 10-year PV | Terminal PV | Balance-sheet adjustment | Fair market cap | Fair value/share | Margin of safety | Terminal share |
|---|---|---|---|---|---|---|---|---|---|---|
Bear | 3.4% / 3.0% | 11.0% | 2.0% | $223M | $177M | -$315M | $85.7M | $3.72 | -1062.4% | 44.3% |
Base | 9.4% / 4.7% | 9.0% | 3.0% | $311M | $464M | -$315M | $460M | $20 | -116.6% | 59.9% |
Bull | 15.4% / 6.1% | 8.5% | 3.5% | $402M | $818M | -$315M | $906M | $39.3 | -10.0% | 67.0% |
In the reverse-DCF, holding the 9% discount rate and 3% terminal growth fixed, and solving only for one constant growth rate rather than using the base-case growth path, the current market capitalization implies roughly 14.2% annual free cash flow growth for ten years. This is a sensitivity framework, not a price target: the terminal-value share shows how strongly each result depends on assumptions beyond the explicit forecast. Negative margin of safety means the current market capitalization exceeds the scenario value.
Five Value-Investing Lenses
Benjamin Graham Lens
Graham would frame the question as whether the dated price provides a margin of safety against a conservatively measured downside. With $76.8 million of cash, $460.3 million of inventory and $689.1 million of stockholders' equity, the tangible book value (excluding goodwill of $132.5 million and intangibles of $139.2 million) is about $417.4 million, well below the dated market capitalization of $995.8 million. Long-term debt of $365.4 million and short-term debt of $11.8 million against $76.8 million of cash leave a net-debt position of $314.8 million, so enterprise value sits above tangible book value by a wide margin. On the author's net-working-capital floor, using cash plus receivables plus inventory less accounts payable (and excluding the broader mix of current liabilities such as customer deposits, warranty reserves and accrued compensation), the result is comfortably negative, which fails the traditional test; the author labels this as an editorial floor rather than a directly filed figure. The dated market price therefore does not provide a margin of safety on the Graham framework.
Benjamin Franklin Lens
Franklin's modern application is thrift, compounding and opportunity cost. Astec pays a $0.13 quarterly dividend, which at the dated price of $43.25 yields about 1.2% in cash, and the company has not been repurchasing shares. The opportunity cost question is whether the capital spent on TerraSource ($252.6 million) and CWMF ($70.1 million) will compound at a rate above the cost of the new borrowings; with $7.1 million of quarterly interest expense against $10.5 million of quarterly net income, the headroom is narrow. Capital discipline, not capital abundance, is the operative discipline here.
Warren Buffett Lens
Buffett would ask whether normalized owner earnings justify the enterprise value and whether the moat and management warrant a premium. Operating cash flow minus capital expenditure on a trailing-twelve-month basis yields about $32.4 million, while enterprise value at the dated market capitalization sits at roughly $1.31 billion; that implies a free-cash-flow yield of about 2.5% before considering growth. For owner economics to justify the price, normalized free cash flow would need to compound at a demanding rate for ten years, well above the demonstrated growth profile. Capital allocation has shifted decisively toward acquisitions funded with debt; Buffett would likely want to see integration evidence before paying a premium for the roll-up story.
Charlie Munger Lens
Munger would invert the question: what would have to be true for this to be a great investment, and is it? The required assumptions are that TerraSource and CWMF integrate cleanly, that data-center-driven aggregate demand persists, that the ERP rollout does not disrupt operations and that operating margins expand meaningfully above the current low-single-digit level. None of these is demonstrated in the filings; the most likely wrong assumption is that acquisition-driven top-line growth translates into durable operating margin. Opportunity cost is also unfavorable: a 2.5% free-cash-flow yield with a demanding growth requirement is a lower-quality return profile than many alternative industrials with steadier margins and less balance-sheet leverage.
Li Lu Lens
Li Lu would frame the question as circle of competence, culture and permanent-loss risk. Astec is a capital-goods business in a cyclical end market; the equipment itself is inside any reasonable circle of competence, but the multi-acquisition, debt-funded roll-up is more difficult to underwrite. The most plausible permanent-loss path is balance-sheet stress if a downturn arrives before TerraSource and CWMF synergies are realized; long-term debt of $365.4 million is roughly 4.3 times trailing-twelve-month operating income, and goodwill plus intangibles of $271.7 million sit on the balance sheet subject to impairment testing. Culture evidence is limited to filings, but the multi-year ERP and internal-control rollout and the explicit segment-level KPI disclosure (Segment Operating Adjusted EBITDA) suggest a degree of operating discipline. On the durability side, parts and service provide a recurring cash anchor, but the dated price is well above what even the bull-case valuation analysis supports, so the durability is not yet priced attractively.
Risks, Disconfirming Evidence, and What Would Prove This Thesis Wrong
Three observable thesis breakers would force a re-evaluation. First, a sustained downward revision in U.S. non-residential or infrastructure construction spending that compresses backlog below the $601.1 million reported at June 30, 2026. Second, a further leg up in interest expense or covenant pressure on the 2025 credit facility if free cash flow fails to keep pace with debt service; current quarterly interest of $7.1 million already exceeds quarterly operating income of $20.4 million by a wide margin relative to the company's historical norm. Third, an ERP-related disruption or goodwill impairment during the multi-year system rollout that materially affects reported earnings or internal controls.
Disconfirming evidence within the filings includes the Q3 2025 net loss of $4.2 million and negative operating cash flow of $8.1 million for the quarter, both of which highlight how quickly the model can swing when timing of working capital and demand mix shift. The 2025 credit facility is the central funding tool, and the 2026 acquisitions were funded through a mix of credit-agreement proceeds and cash on hand; if leverage covenants tighten or spreads widen, the cost of capital could rise quickly. Conversely, evidence that would support a more constructive view includes a sustained backlog above $600 million, two consecutive quarters of mid-single-digit operating margin, and the successful integration of TerraSource and CWMF as evidenced by gross margin stability and parts/service growth.
Investment Conclusion
The dated market capitalization of $995.8 million sits well above the deterministic base-case fair market value, and only the bull-case fair market value approaches the dated equity value; even that bull case assumes a demanding annual free-cash-flow growth path in the deterministic reverse-DCF and a low discount rate. With operating margin near 5% and FCF margin near 2% on a trailing-twelve-month basis, the dated price embeds an aggressive growth and margin-expansion assumption that the filings do not directly support. The balance sheet is in a net-debt position of $314.8 million, the acquisition pipeline is large and recent, and free cash flow remains thin. The dated price therefore does not provide a margin of safety, and the deterministic base case is consistent with an Overvalued conclusion.
This article is for educational and informational purposes only and does not constitute investment advice, a recommendation or a solicitation to buy or sell any security. All figures derive from publicly filed SEC documents and a dated market snapshot; readers should consult the original filings and a qualified adviser before making any investment decision.
Share this article