The investment case — and what could go wrong
- Revenue was $236.8 million, up 20.7% from $196.2 million in the third quarter of 2025.
- Customers buy capital equipment, consumable products, activity-based equipment, and related services that improve safety, efficiency, and environmental performance.
- The transaction was funded partly with equity, causing dilution.
Selected from this article · 2026-11-01
Read on for the full pictureThe Quarter in Context
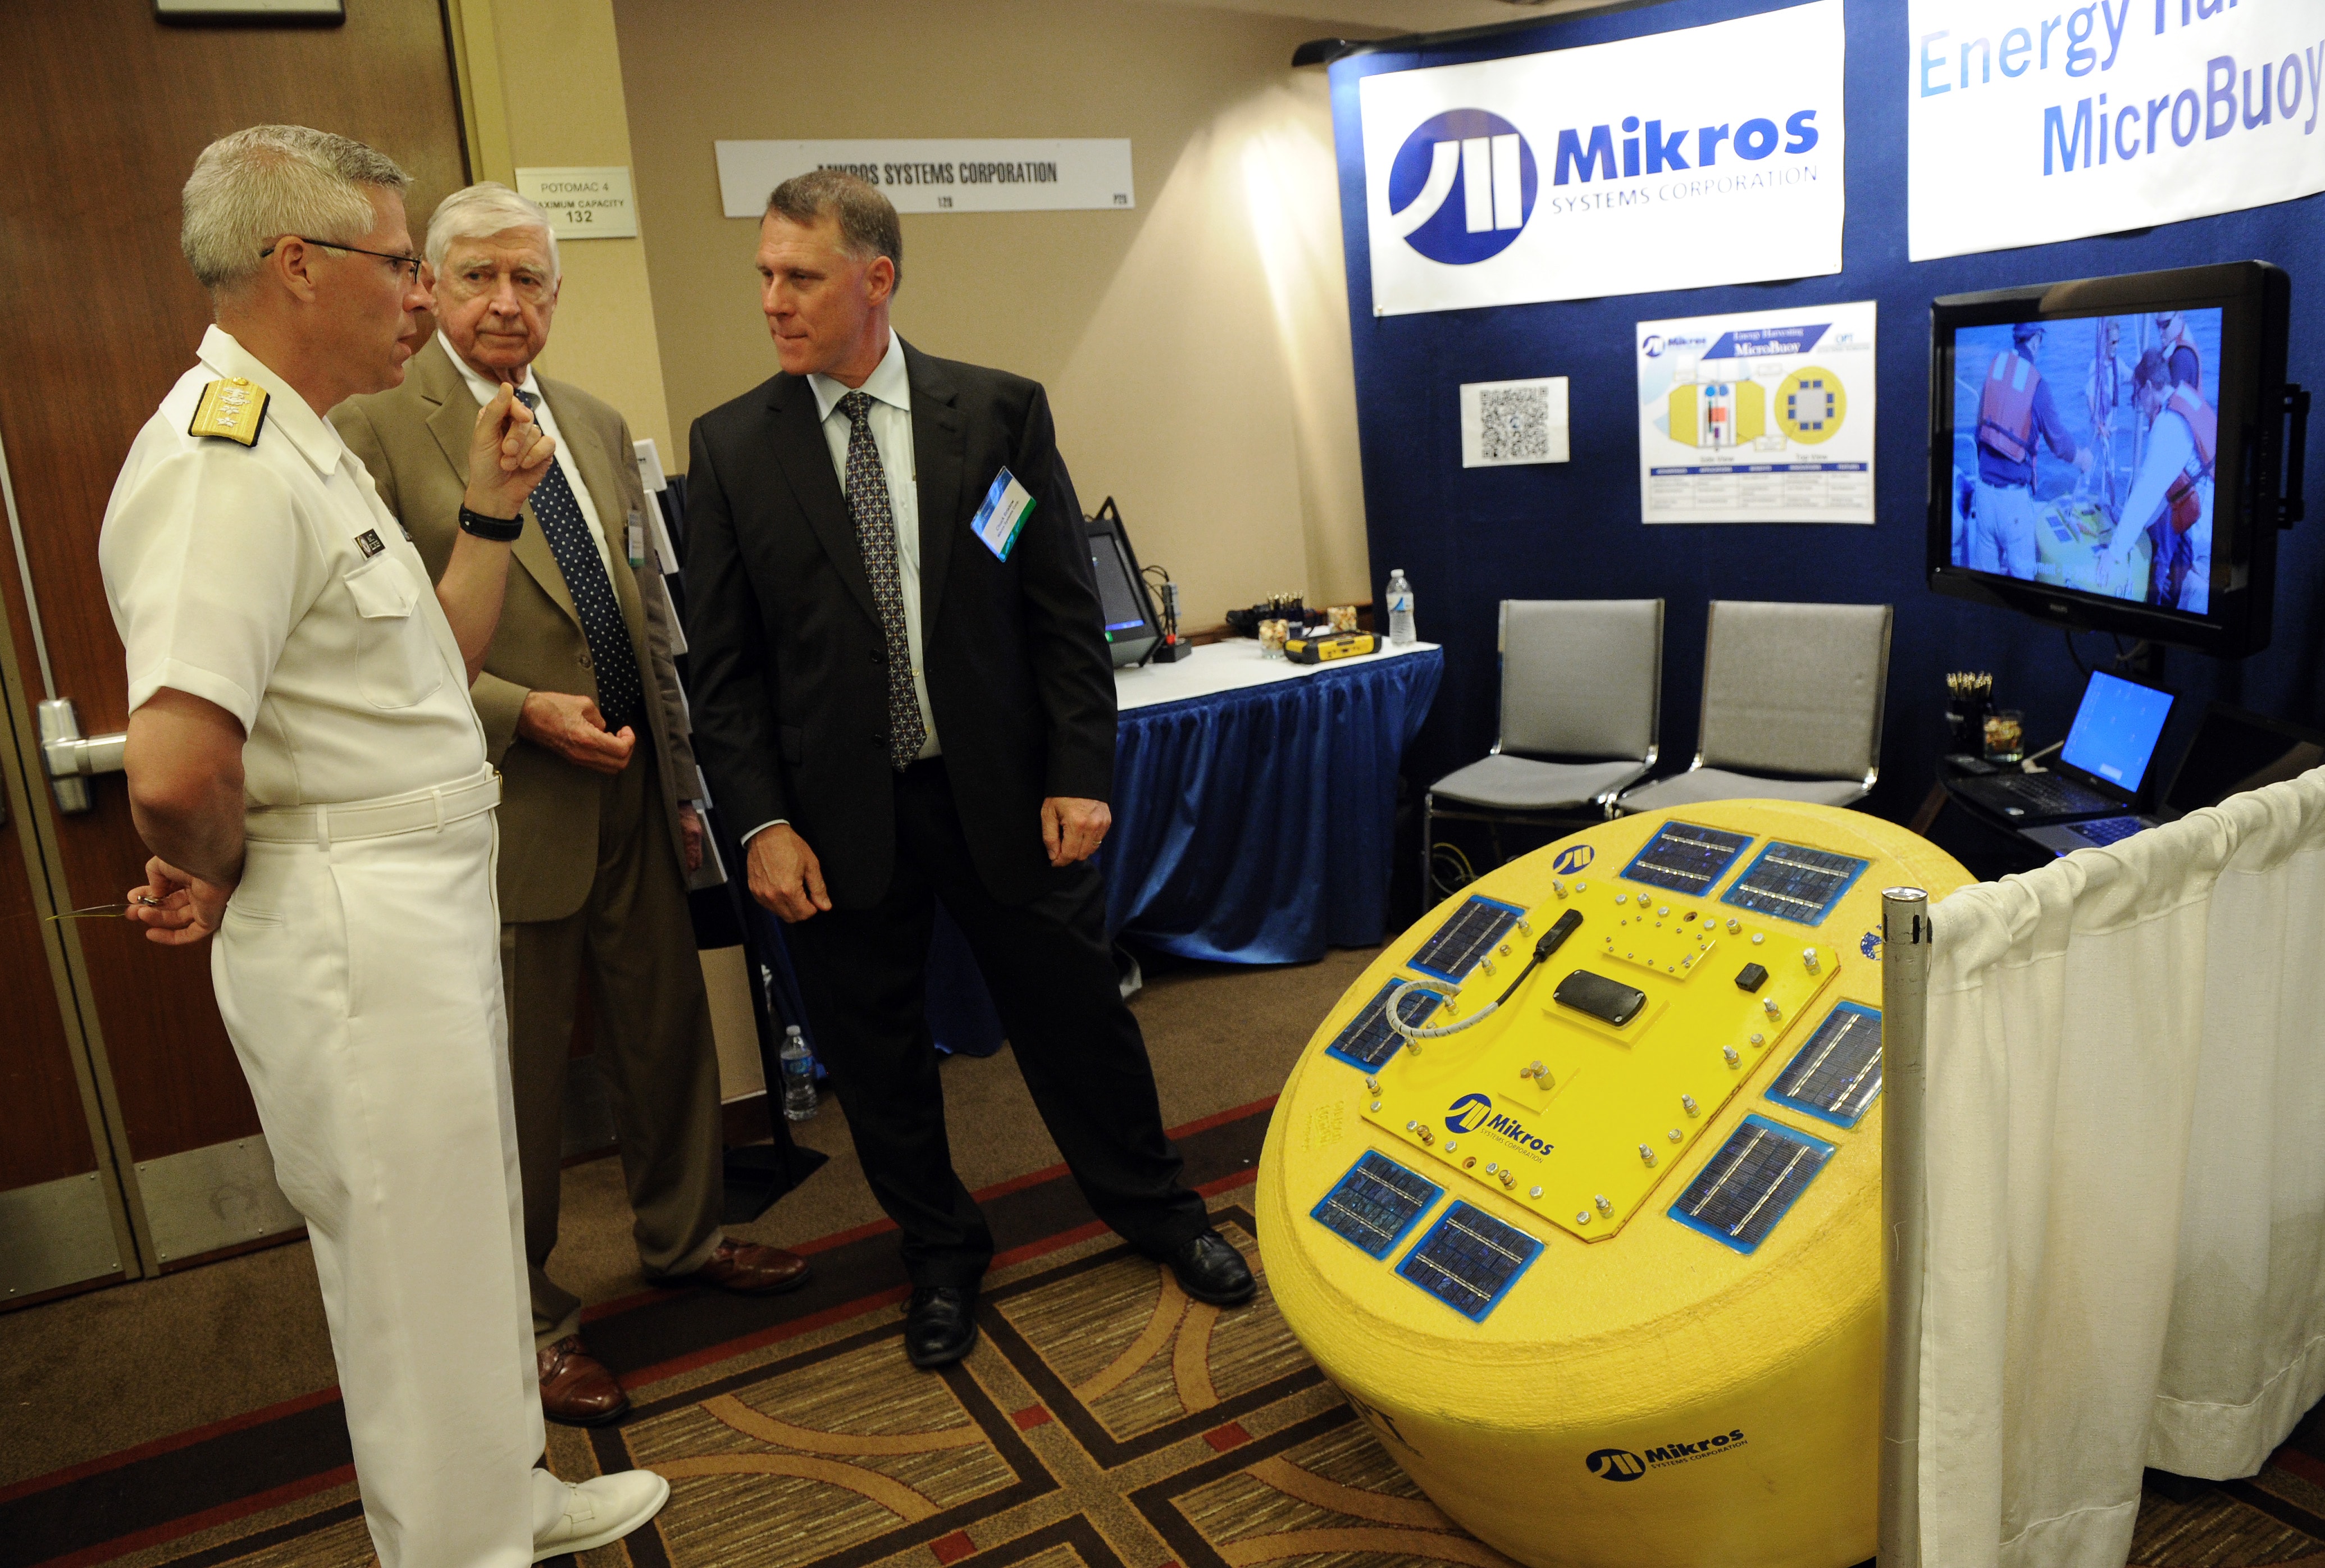
Forum Energy Technologies, Inc. (FET) reported a strong quarter ended September 30, 2026. Revenue was $236.8 million, up 20.7% from $196.2 million in the third quarter of 2025. Gross profit rose to $74.4 million from $40.2 million, while operating income swung to $19.96 million from a $6.11 million loss. Net income was $11.23 million, or $0.93 per diluted share, versus a $20.55 million loss in the prior-year quarter.
The improvement came from both segments. Drilling and Completions revenue increased 25.3% to $147.2 million, and its operating margin reached 9.7%, compared with negative 11.5% a year earlier. Artificial Lift and Downhole revenue increased 13.8% to $89.9 million, while segment operating margin improved to 17.9% from 14.9%. Management attributed Drilling and Completions improvement to revenue growth, operating leverage, cost savings, and an easier comparison against prior-year inventory write-downs, impairments, and facility/product rationalization charges.
This is meaningful operating progress, but it does not establish a new normal. Global active rigs numbered 1,901 in the third quarter of 2026, up from 1,797 a year earlier, while management also cited improved international and offshore activity. The filing also warned that interim results are not necessarily indicative of later periods. Accordingly, the quarter is evidence of recovering utilization and better cost absorption, not proof that recent margins are sustainable through the cycle.
Business Model and Profit Engine
FET is a global manufacturer serving oil and natural gas operators, oilfield service companies, pipeline and refinery operators, defense contractors, and renewable-energy companies. Customers buy capital equipment, consumable products, activity-based equipment, and related services that improve safety, efficiency, and environmental performance. In 2025, approximately 80% of revenue came from consumable products and activity-based equipment, with most of the balance from capital products and a small amount from rental and services.
The two reported profit engines are Drilling and Completions and Artificial Lift and Downhole. Drilling and Completions includes drilling equipment and consumables, subsea vehicles and components, pressure-pumping equipment, wireline and pressure-control products, and coiled tubing. Artificial Lift and Downhole sells artificial-lift systems, sand and flow-control equipment, downhole products, valves, and production technologies. In the third quarter of 2026, Drilling and Completions produced 62.1% of revenue, while Artificial Lift and Downhole produced 37.9%.
Revenue becomes gross profit through product pricing, material and labor costs, factory utilization, warranty and freight effects, and mix. It becomes operating profit after selling, general and administrative expenses, corporate costs, transaction expenses, and disposal items. The sharp third-quarter improvement in Drilling and Completions illustrates operating leverage: revenue increased $29.7 million, while segment operating results improved $27.8 million. That means a relatively high proportion of incremental revenue converted into segment profit, although some of the gain reflected the absence of prior-year charges rather than pricing alone.
Pricing power is only partly evidenced. The filing describes engineered and mission-sensitive products, refurbishment and recertification requirements, and demand tied to offshore, drilling, and completion activity, but does not disclose product-level price changes or realized margins. Capital equipment is project- and transaction-oriented; consumables and aftermarket activity are more recurring but still depend on customer utilization. The company does not disclose customer concentration in the available evidence, nor product-line gross margins, so the degree of cross-subsidy and pricing durability cannot be established.
Working capital is a meaningful part of the engine. Receivables were $178.3 million and net inventory $245.1 million at September 30, 2026, both substantial relative to quarterly revenue. Inventory included $95.8 million of raw materials and parts, $31.5 million of work in process, and $145.6 million of finished goods before the reserve. A demand slowdown could therefore release cash through lower production but also trigger write-downs or excess capacity.
Capital intensity appears moderate at the property and equipment level, but the business also carries substantial operating leases. Capital expenditures were $4.9 million in the first nine months of 2026, and management expects full-year capital expenditures below $10 million, primarily for replacement of end-of-life machinery and equipment. That expectation is management’s forward statement, not actual fourth-quarter spending or a complete maintenance-versus-growth split.
Earnings Quality and Cash Conversion
Quarterly cash-flow calculations below subtract two reported cumulative statements. These are author calculations, not directly reported quarterly line items. Amounts are USD.
Metric | Quarter | Cumulative less preceding cumulative | Calculated quarter | Sources |
|---|---|---|---|---|
Operating cash flow | 2026-07-01 to 2026-09-30 | $46,087,000 (2026-09-30) minus ($14,056,000; 2026-06-30) | $32,031,000 | Statements through 2026-09-30 and 2026-06-30 |
Operating cash flow | 2025-07-01 to 2025-09-30 | $47,965,000 (2025-09-30) minus ($25,099,000; 2025-06-30) | $22,866,000 | Statements through 2025-09-30 and 2025-06-30 |
Capital expenditure | 2026-07-01 to 2026-09-30 | $4,911,000 (2026-09-30) minus ($3,189,000; 2026-06-30) | $1,722,000 | Statements through 2026-09-30 and 2026-06-30 |
Capital expenditure | 2025-07-01 to 2025-09-30 | $4,453,000 (2025-09-30) minus ($3,061,000; 2025-06-30) | $1,392,000 | Statements through 2025-09-30 and 2025-06-30 |
Where the issuer reports cash flow and capital expenditure cumulatively, the standalone-quarter cash-flow figures are derived by subtracting the preceding cumulative filing. They are calculations from SEC facts rather than separately reported quarterly line items.
Cash conversion in the third quarter of 2026 was strong. Derived by subtracting the six-month 2026 cumulative operating cash flow of $14.056 million from the nine-month cumulative $46.087 million, standalone third-quarter operating cash flow was $32.031 million. Derived capital expenditure was $1.722 million, using the same cumulative-statement method. The resulting $30.309 million is an accounting operating-cash-flow-minus-capex proxy, not normalized owner earnings.
For the twelve months ended September 30, 2026, operating cash flow was $68.524 million and capital expenditure was $6.473 million, producing a $62.051 million accounting free-cash-flow proxy. This is the dated valuation base, but it combines different quarters and is not a mid-cycle estimate. The company does not separate maintenance capital expenditure from growth capital expenditure, and the proxy does not deduct stock-based compensation as a recurring economic cost.
The nine-month cash-flow statement also reveals why reported earnings and cash can diverge. Net income was $28.129 million, but operating cash flow was only $46.087 million. Accounts receivable used $36.567 million of cash, inventories used $12.569 million, and contract-related changes were also meaningful. Accounts payable, deferred revenue, and accrued liabilities available $36.030 million, partly offsetting the build. In other words, growth improved profit but also absorbed working capital.
The year-over-year cash comparison is more restrained than the earnings comparison. Nine-month operating cash flow was $46.087 million in 2026 versus $47.965 million in 2025, despite a large improvement in net income. Management attributed the decline primarily to higher working-capital requirements associated with revenue growth.
Balance-sheet cash conversion should therefore be judged over several quarters. Receivables and inventory fund customer deliveries, but they are not cash until collected or sold. Conversely, reported cash flow can benefit from stretched payables or contract billings. The critical checks are whether receivable growth continues to track revenue, inventory reserves remain controlled, and free cash flow remains positive after replacement capital spending and acquisition spending.
Business Quality, Moat, and Industry Position
FET occupies an important but generally nonexclusive position in the oilfield equipment supply chain. It sells engineered equipment and consumables to drilling contractors, oilfield service companies, operators, pipeline and refinery operators, defense contractors, and renewable-energy customers. Its upstream inputs include metals, electronics, hydraulic components, and specialized manufacturing capacity; it converts them into capital equipment, consumables, and services used in demanding drilling, subsea, completion, and production environments.
The most defensible moat evidence is product specificity and qualification rather than exclusive control of a scarce resource. Examples include remotely operated vehicles and subsea components, pressure-control equipment requiring refurbishment and recertification, high-pressure pumping systems, coiled-tubing strings, and torque-ring products with patents. These products can be important to safety and uptime, and some require technical service, recertification, or customer-specific integration.
However, the available evidence does not establish core bottleneck economics. Substitutability, capacity elasticity, customer switching costs, supplier concentration, and FET’s share of customer spending are not quantified. Direct customers are identifiable, but no customer-concentration table or external customer interviews are available. The defensible classification is therefore important participant rather than core bottleneck: strategic relevance in selected applications does not by itself give FET pricing power.
Demand is cyclical and project-driven. Global rig activity improved in the third quarter of 2026, but capital spending also depends on offshore projects, customer budgets, commodity economics, replacement cycles, and government programs. FET’s mix of consumables, aftermarket, capital equipment, defense, and renewable-energy exposure may diversify demand, yet the current filings do not quantify those offsets.
The strongest visible evidence is the recovery in Drilling and Completions from a loss-making prior-year quarter and sustained double-digit segment operating income in Artificial Lift and Downhole. The weakest is external verification: no available competitor data, customer interviews, win rates, or market-share data independently confirm the durability of recent margins.
Management and Capital Allocation
Observable conduct shows management pursuing operational repair, selective growth, and shareholder returns. Facilities were consolidated, certain products discontinued, and cost savings contributed to the third-quarter recovery. Inventory write-downs fell to $6.541 million in the first nine months of 2026 from $17.407 million a year earlier, although write-downs continued.
The August 6, 2026 acquisition of Premiere Torque Rings expanded the Downhole offering. Consideration had an acquisition-date fair value of $34.4 million, including $11.8 million cash, $16.2 million of stock, deferred cash, and contingent consideration. PTR contributed to Artificial Lift and Downhole income, but its revenue and earnings were not material in the quarter, and its acquisition-date goodwill of $14.8 million plus $15.4 million of identifiable intangibles creates future impairment exposure. The transaction was funded partly with equity, causing dilution.
Capital allocation remains mixed. During the first nine months of 2026, the company spent $8.962 million on repurchases per the cash-flow statement (MD&A reports approximately $9.0 million), paid $9.274 million for taxes related to stock compensation, made $11.833 million of cash acquisition payments, and made $7.2 million of net repayments under the revolving Credit Facility. Stock-based compensation was $7.707 million. The company also had $31.7 million of remaining repurchase authorization as of September 30, 2026.
Repurchases can be sensible below intrinsic value, but they compete with debt reduction, acquisition funding, and working-capital resilience. With cash of $35.169 million and carrying-value debt of $127.676 million, priorities should favor balance-sheet flexibility unless the shares are clearly discounted. Conversely, paying some acquisition consideration in equity limits immediate cash strain, while the issuance adds to the per-share burden.
Culture can create or destroy value. Positively, management disclosed segment results, charges, acquisition terms, liquidity, covenant compliance, and management’s capex expectation. Negatively, the retained deficit, expensive secured debt, prior restructuring charges, and mixed repurchase-versus-deleveraging choices require continuing scrutiny. Tacit judgments about management quality cannot be established from one quarter of improvement.
Valuation and What the Market Already Expects
At the October 31, 2026 market close snapshot, FET traded at $88.76 and had a market capitalization of $1.018 billion. The dated market capitalization represents equity value; adding cash and subtracting debt would be needed only to begin an enterprise-value comparison.
The September 30, 2026 balance sheet provides $35.169 million of cash and no separately identified short-term investments. The selected debt basis is total carrying-value long-term debt of $127.676 million, consisting of $1.125 million current and $126.551 million noncurrent; the reported long-term aggregate equals the component total, with no unexplained difference. Short-term borrowings were not separately available and should not be treated as reported zero. The resulting net cash adjustment is negative $92.507 million.
The $62.051 million trailing free-cash-flow proxy produces a cash-flow yield of roughly 6.1% on the dated equity market capitalization. That is a dated starting point, not a sustainable yield: the period includes a cyclical recovery, working-capital swings, and no maintenance/growth capex split. Market capitalization also appears to require continued operating normalization and growth beyond the observed trailing cash-flow base rather than assuming a rapid collapse.
The principal valuation burden is execution. The business must convert higher revenue into durable margins without accumulating receivables or obsolete inventory, while servicing debt carrying a 10.5% coupon on the $100 million 2029 bonds. It must also prove that PTR integration and repurchases create per-share value rather than merely offsetting inflation in the share count. The qualitative implication is neither cheapness by itself nor overvaluation: the dated price offers potential support if mid-cycle cash generation holds, but it does not eliminate cycle, leverage, and execution risk.
Ten-Year Cash Flow to Fair Market Value
The starting free cash flow is the normalized SEC cash-flow proxy, while every growth rate, discount rate and terminal rate below is an explicit editorial assumption rather than company guidance. Each annual cash flow is forecast and discounted separately; terminal value is year-ten free cash flow multiplied by one plus terminal growth, divided by discount rate minus terminal growth, and then discounted back ten years. Fair market capitalization equals that explicit ten-year present value plus discounted terminal value and a same-date balance-sheet adjustment when available. If current cash and debt facts do not share one report date, the table shows the adjustment as unavailable and conservatively applies zero. The share count is derived from the dated market capitalization and share price so US shares and foreign ADRs use a consistent traded-security denominator.
Year | Bear FCF | Base FCF | Bull FCF |
|---|---|---|---|
1 | $63.5M | $67.2M | $70.9M |
2 | $64.9M | $72.7M | $81M |
3 | $66.4M | $78.8M | $92.6M |
4 | $67.9M | $85.3M | $106M |
5 | $69.4M | $92.3M | $121M |
6 | $71.3M | $96.1M | $127M |
7 | $73.3M | $100M | $134M |
8 | $75.3M | $104M | $141M |
9 | $77.4M | $109M | $149M |
10 | $79.5M | $113M | $157M |
Scenario | Growth years 1–5 / 6–10 | Discount | Terminal | 10-year PV | Terminal PV | Balance-sheet adjustment | Fair market cap | Fair value/share | Margin of safety | Terminal share |
|---|---|---|---|---|---|---|---|---|---|---|
Bear | 2.3% / 2.8% | 11.0% | 2.0% | $0.409B | $0.317B | -$0.0925B | $0.634B | $55.2 | -60.7% | 43.7% |
Base | 8.3% / 4.1% | 9.0% | 3.0% | $0.566B | $0.82B | -$0.0925B | $1.29B | $113 | 21.3% | 59.1% |
Bull | 14.3% / 5.4% | 8.5% | 3.5% | $0.732B | $1.44B | -$0.0925B | $2.08B | $181 | 51.0% | 66.3% |
In the reverse-DCF, holding the 9% discount rate and 3% terminal growth fixed, and solving only for one constant growth rate rather than using the base-case growth path, the current market capitalization implies roughly 3.5% annual free cash flow growth for ten years. This is a sensitivity framework, not a price target: the terminal-value share shows how strongly each result depends on assumptions beyond the explicit forecast. For positive scenario equity values, negative margin of safety means the current market capitalization exceeds the scenario value. For zero or negative scenario equity values, a margin-of-safety percentage is not meaningful; the obligations exhaust the modeled enterprise value.
Five Value-Investing Lenses
Benjamin Graham Lens
The Graham question is whether a decline in earnings or market sentiment would leave permanent impairment. At September 30, 2026, FET had $35.169 million of cash, $127.676 million of carrying-value debt, $318.187 million of equity, and $94.0 million of unused credit-facility availability. The 2029 bonds require 10.5% cash interest and mature in 2029, while the revolver extends to 2031 subject to its borrowing-base mechanics. The balance sheet is serviceable but not fortress-like. Graham discipline therefore supports a margin-of-safety requirement, especially because earnings depend on cyclical utilization and working capital.
Benjamin Franklin Lens
Franklin’s modern application is thrift, compounding, and opportunity cost. During the nine months ended September 30, 2026, FET made $7.2 million of net repayments under its revolving Credit Facility and consolidated facilities and discontinued weak products, but it simultaneously spent $8.962 million on repurchases, $9.274 million on stock-compensation taxes, and $11.833 million of cash on PTR while carrying 10.5% secured bonds. These revolver repayments do not establish general balance-sheet deleveraging. The right comparison is not whether a use of cash sounds productive; it is whether debt repayment, selective buybacks, or reinvestment produces the highest risk-adjusted return per share. Until cash conversion persists and the acquisition earns its cost of capital, debt reduction and disciplined reinvestment deserve priority.
Warren Buffett Lens
Buffett’s lens asks whether accounting earnings become distributable owner economics. The $62.051 million trailing operating-cash-flow-minus-capex proxy is useful, but it is not normalized owner earnings: capital expenditure is not separated into maintenance and growth, and stock compensation of $10.377 million on a trailing basis is not deducted in the proxy. A Buffett-style bridge would treat recurring stock compensation as a real cost and require capital spending sufficient to maintain productive capacity, including lease and replacement commitments. On the available evidence, FET’s owner economics are improving but not yet fully established. The PTR purchase also demands evidence that synergies exceed amortization, integration costs, and dilution.
Charlie Munger Lens
Munger’s lens emphasizes incentives, inversion, and avoidable bias. Management’s incentive structure includes time-based equity, relative-TSR awards, free-cash-flow awards, and stock-price hurdles, so some compensation aligns with performance and market outcomes while also creating dilution. The most likely wrong assumption is that Q3’s margin rebound represents normalized mid-cycle economics. Inversion says to test the opposite: orders could weaken, inventory could require write-downs, receivable growth could consume cash, and high fixed costs could magnify a downturn. The appropriate bias control is to demand several quarters of cash-backed earnings and conservative valuation rather than extrapolating the strongest quarter.
Li Lu Lens
Li Lu’s lens asks whether FET is within a circle of competence and whether durable advantages can withstand permanent-loss risk. The company is understandable at a high level: it makes engineered equipment and consumables whose demand follows drilling, completion, production, offshore, and industrial activity. Its advantages—patented products, specialized engineering, installed applications, and recertification—are real but only partly quantified. The absence of external customer evidence, market-share data, and concentration disclosure limits confidence. Durable value also depends on culture: repair actions and candid segment reporting help, but expensive debt, repurchases, acquisitions, and continuing restructuring must produce returns above their cost.
Risks, Disconfirming Evidence, and What Would Prove This Thesis Wrong
The first thesis breaker is a return to negative or near-zero Drilling and Completions operating profit despite stable revenue. The observable indicators would be segment operating margin falling materially below the third-quarter 2026 level, renewed inventory write-downs and impairments, and management attributing weakness to structural demand rather than temporary timing. The prior-year loss shows that this is possible.
The second breaker is cash conversion failing to follow earnings. Indicators include operating cash flow falling below nine-month net income for several periods, receivables growing faster than revenue, inventory continuing to rise, and the trailing accounting free-cash-flow proxy declining materially from $62.051 million. A single quarter can be distorted by billing, but persistent divergence would invalidate the cash-backed earnings thesis.
The third breaker is balance-sheet stress. Indicators include falling credit availability as the borrowing base contracts, covenant headroom narrowing, further borrowing under the revolver, delayed debt reduction, or inability to meet the bonds’ minimum liquidity test. FET reported covenant compliance and $94.0 million of availability at September 30, 2026, so this is a future falsification condition rather than a present default.
The fourth breaker is poor acquisition or share-repurchase economics. Evidence would include PTR failing to improve Artificial Lift and Downhole profit, impairment of the new goodwill or intangibles, declining earnings per share despite buybacks, or repurchases continuing while debt and interest costs remain high.
The most likely wrong assumption is that Q3’s 20.7% revenue growth and 8.4% operating margin are durable mid-cycle characteristics. The opportunity cost is also material: cash committed to acquisitions and buybacks cannot simultaneously provide liquidity protection, and buying a cyclical recovery at a high market multiple can convert temporary earnings into permanent capital loss.
Investment Conclusion
FET’s third quarter ended September 30, 2026 was a meaningful operational improvement: both segments earned positive operating income, revenue grew 20.7%, and derived third-quarter operating cash flow exceeded accounting capital expenditure by a wide margin. The evidence supports a recovering cyclical business with useful engineered products, not a proven secular compounder.
At the October 31, 2026 price of $88.76, the valuation offers potential support under a credible normalization case, but the burden of proof remains material. The base valuation depends on continued cash-flow growth and disciplined execution; the bear case exposes substantial downside. Net debt, 10.5% secured bonds, inventory, receivable growth, acquisition dilution, and uncertain mid-cycle margins prevent a high-conviction Graham-style margin of safety.
The conclusion is Worth watching, with medium confidence. The business has moved beyond the strongest part of the bear case, yet the investor should demand sustained cash-backed margins, falling working-capital intensity, and disciplined allocation before treating recent earnings as durable. This article is for educational use only and is not personalized investment advice.
Share this article