The investment case — and what could go wrong
- Revenue of $323.2 million was down roughly 28% from the $447.6 million reported in the prior-year quarter, yet reported net income still reached $87.1 million, only about 53% lower year over year.
- The filing reports a single operating segment, so the unit economics across basins are not visible in the available evidence; segment-level operating income, capital intensity and individual basin cash margins are data gaps rather than disclosed facts.
- Total debt of $922.3 million against only $1.1 million of cash means the balance sheet is fully debt-funded; any softness in operating cash flow would directly impair the share repurchase program.
Selected from this article · 2026-10-16
Read on for the full pictureThe Quarter in Context
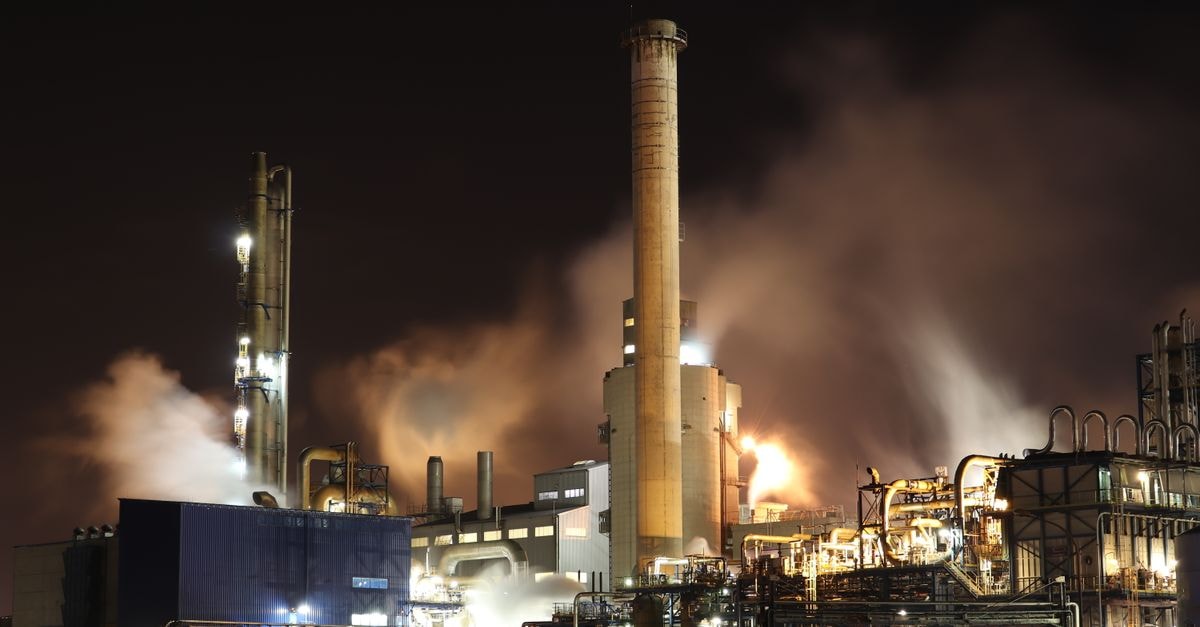
Gulfport Energy is a natural gas-weighted independent producer operating in the Utica/Marcellus and SCOOP plays, and the second quarter of 2026 captures a company running hot against a tougher pricing tape. Revenue of $323.2 million was down roughly 28% from the $447.6 million reported in the prior-year quarter, yet reported net income still reached $87.1 million, only about 53% lower year over year. That divergence was driven by a $61.7 million net derivative gain, lease operating and tax costs that grew modestly, and a depressed effective tax rate because deferred tax expense was just $24.3 million against $111.1 million of pre-tax income. The quarter was not a clean operating beat; it was a quarter in which hedges and tax geometry held reported earnings together while headline commodity realizations weakened. The reader should treat the second-quarter result as a cycle print, not a steady-state earnings run-rate.
For the first six months of 2026, revenue was $760.8 million, up about 18% versus the prior-year period, but that comparison was distorted by the prior-year's negative derivative mark, which has since reversed to a positive $45.9 million in the current period. Operating cash flow for the first half was $442.8 million, against $313.0 million of cash additions to oil and gas properties, leaving roughly $130 million of free cash flow before financing and buybacks. That free-cash-flow figure is an author calculation from reported SEC facts; the filing does not present a labeled free-cash-flow line, and capital expenditures are not split between maintenance and growth.
Business Model and Profit Engine
Gulfport earns its revenue by producing natural gas, oil/condensate and natural gas liquids from working interests in eastern Ohio (Utica/Marcellus) and central Oklahoma (SCOOP Woodford and Springer) and selling them to commodity purchasers, with derivative instruments layered on top to smooth the realized price. The filing reports a single operating segment, so the unit economics across basins are not visible in the available evidence; segment-level operating income, capital intensity and individual basin cash margins are data gaps rather than disclosed facts. Who pays: the customers are commodity buyers, including interstate pipelines and processors; what they buy is largely dry natural gas, with condensate and NGL as byproduct streams. Pricing is dictated by external indices (NYMEX, regional gas hubs), and Gulfport does not appear to control absolute price levels; its lever is hedge book construction and well productivity.
Revenue becomes gross profit and operating profit after deducting lease operating expense, taxes other than income, transportation/gathering/processing/compression, depreciation, depletion and amortization, general and administrative and accretion. In Q2 2026, total operating expenses were $196.2 million against $323.2 million of revenue, yielding operating income of $127.1 million and a 39.3% operating margin. The big fixed cost lines are transportation, gathering, processing and compression ($84.6 million in the quarter) and DD&A ($73.1 million), which together account for the majority of operating costs and signal that midstream fees and reservoir depletion economics drive the cost base rather than variable LOE ($19.8 million). DD&A is a non-cash, volume-driven proxy for capital intensity; the filing shows proved properties of roughly $4.2 billion at June 30, 2026 against $2.0 billion of accumulated DD&A, indicating a still-young meaningful reserve base. The filing does not separate maintenance from growth capex; we can see only that six-month cash additions to properties were $312.8 million, while management expects roughly $395.0 million of operated drilling and completion capex for full-year 2026 plus about $35.0 million of maintenance land/seismic and a $140.0 million 2026 discretionary acreage program. Whether drilling and completion capex is growth-only or includes an element of maintenance is not stated; the company's language characterizes the operated capital program in growth terms. Customer concentration is not disclosed in the cited excerpts; midstream dependency (transportation and processing fees of $84.6 million per quarter) is the more concrete structural feature.
Profit conversion to cash looks reasonable on the surface, with operating cash flow of $149.9 million in the quarter, but that figure embeds the favorable derivative and deferred-tax-movement tailwind. Working capital was a $33.6 million source of cash for the half year, primarily from a $70.3 million reduction in oil/gas/NGL receivables, suggesting the second-quarter revenue weakness was partly cash-collection timing rather than purely commodity. Capital intensity is high; investing activities used $314.0 million in six months, financed by $442.8 million of operating cash flow plus $133.0 million of net debt draws, with $242.3 million of buybacks on top. The price paid for the buyback at an average $192.91 per share materially exceeded the quarter-end cash balance, which means repurchases were debt-funded at the margin.
Earnings Quality and Cash Conversion
Where the issuer reports cash flow and capital expenditure cumulatively, the standalone-quarter cash-flow figures are derived by subtracting the preceding cumulative filing. They are calculations from SEC facts rather than separately reported quarterly line items. Reported earnings benefited from a $61.7 million net derivative gain and a low effective tax rate; the filing shows $24.0 million of tax expense against $111.1 million of pre-tax income, an effective rate near 21.6%, well below the statutory 21% plus state blend because of a modest current tax benefit. Cash conversion looks decent, but the half-year operating cash flow of $442.8 million was supported by $45.9 million of non-cash derivative mark-to-market gains and $20.9 million of net derivative cash payments, a mixed signal: mark-to-market is favorable but cash settlements are negative because the existing hedge book is settling below current spot. Stock-based compensation in the half-year was $2.9 million on the cash flow statement (broader than the $2.7 million figure reflected in the three-month stock-based compensation expense shown on the income statement, which excludes capitalized amounts), a minor non-cash drag.
Capitalized stock-based compensation of $1.4 million for the half means a portion of equity-based pay is being absorbed into the property base rather than the income statement, which slightly understates stated operating income but does not change the underlying cash cost. Interest payments net of capitalized interest were $28.7 million for the half, which is a real cash outflow and is the most reliable indicator of the debt service burden. Total debt of $922.3 million against only $1.1 million of cash means the balance sheet is fully debt-funded; any softness in operating cash flow would directly impair the share repurchase program.
Business Quality, Moat, and Industry Position
On the available evidence, the company is best described as an ordinary participant, not a demonstrated core supply-chain bottleneck. This classification describes strategic position only; it is not independent proof of a moat or valuation upside. Gulfport competes as a mid-sized independent in two core basins, Utica/Marcellus and SCOOP, and the filing frames competitive strength in terms of operational scale and hedge book sophistication rather than proprietary technology. Substitutability is high: oil, natural gas and NGL are largely homogeneous, and the company has no proprietary processing or marketing infrastructure visible in the available evidence. Capacity elasticity is a structural advantage; gas-weighted producers can scale drilling and completion activity with relatively short lead times and well cycle economics, allowing capital to move when commodity prices move. The Utica/Marcellus position in eastern Ohio and SCOOP Woodford/Springer in central Oklahoma are real asset bases, but the filing does not disclose reserve life, finding costs or PV-10 of proved reserves in the cited excerpts, so durability cannot be benchmarked against peers.
Qualification barriers in U.S. unconventional production come from leasehold control, midstream capacity, and the company's description of "held by production" acreage indicates the lease base is supported by existing production rather than pure speculative optionality. The value capture mechanism is straightforward: working interest ownership in producing wells, plus derivative overlay. The bottleneck question is whether Gulfport controls a constraining chokepoint or simply participates in commodity markets. The evidence shows a commodity price taker with hedge overlay, not a pipeline or processor with take-or-pay protection. There is no evidence of long-term fixed-price sales contracts or physical asset ownership that would meaningfully differentiate cash flows from peer gas producers.
Management and Capital Allocation
Management's capital allocation pattern is visible and aggressive. In the first six months of 2026, the company spent $242.3 million on share repurchases (1,258,501 shares at an average $192.91), funded a $313.1 million drilling and completion cash program, paid $28.7 million of cash interest and ended the period with $922.3 million of debt against just $1.1 million of cash. The Repurchase Program is authorized up to $1.5 billion and runs through December 31, 2026; remaining authorization at quarter-end was $336.8 million. That is meaningful, but it is being executed against a balance sheet with essentially no cash, so further buybacks will require either continued operating cash generation, additional debt draws, or both.
Capital expenditures of $150 million during Q2 2026 (which we derived from segment disclosure of $198.5 million of segment-level capital expenditures minus the implied six-month figure) represent a step-up from the $139.5 million incurred in Q2 2025, signaling management is reinvesting heavily even as it returns capital to shareholders. The filing characterizes the operated drilling and completion program of approximately $395 million for 2026 as fully committed to growth rather than maintenance; whether that is accurate is the reader's call, but the language tilts toward growth. Leadership turnover is meaningful: the prior CEO departed on March 6, 2026; the Board installed an Office of the Chairman as interim CODM; Domenic J. Dell'Osso, Jr. was named President and CEO on May 28, 2026; the CFO notified resignation on July 31, 2026 effective August 5, 2026 with the CEO serving as interim principal financial officer until a successor is named. A new CEO and departing CFO during a period of commodity volatility is a concentration of execution risk, not a sign of cultural drift.
Valuation and What the Market Already Expects
Gulfport's dated market capitalization is approximately $2.9 billion against 17.7 million shares outstanding at $163.75 per share. Stockholders' equity at June 30, 2026 was $1.83 billion and total debt was $922.3 million, so enterprise value is approximately $3.82 billion at the dated market cap and balance sheet. The half-year operating cash flow of $442.8 million, if mechanically annualized, would imply $885 million of full-year operating cash flow, but that is a sensitivity, not a forecast, and ignores the working-capital benefit that is unlikely to repeat. The capital expenditure base of about $313 million of cash additions in the half-year implies annualized spending of $625 million, against $885 million of mechanical annualized operating cash flow, or a positive spread of about $260 million before debt service and buybacks.
For a cyclical producer, the valuation question is what mid-cycle cash generation looks like, not what last quarter's price did. The dated market capitalization already implies the market believes Gulfport can earn meaningfully through-cycle returns on its $1.5 billion buyback authorization, fund a $400+ million drilling program, sustain $900 million of debt, and still have something left for shareholders. The reverse-DCF logic is straightforward: even at modest 4-6x mid-cycle EV/EBITDA, the dated market cap appears to be pricing in a sustained natural gas price level meaningfully above what current strips would suggest, with a meaningful tail of upside from the SCOOP and Utica/Marcellus inventory. This is a high-quality operations story priced for cycle persistence, not a cheap, ignored asset. The price does not provide an obvious margin of safety on a multi-year view.
Ten-Year Cash Flow to Fair Market Value
The available deterministic ten-year valuation block is null, so this section discusses only why direct compounding from the current free-cash-flow base is invalid and what normalization would be required for the dated market capitalization to be defensible. Free cash flow cannot be reliably computed for the current period because capital expenditures are not split between maintenance and growth, the filing does not present a labeled free-cash-flow figure, and the working-capital benefit in the half-year is a one-time timing item. Compounding a negative or non-existent current free-cash-flow base to a ten-year fair value would be a fabrication. The honest exercise is to consider three mid-cycle normalization paths for free cash flow, all expressed as author assumptions, not stated forecasts.
In a bear case, assume flat revenue at the trailing-twelve-month run rate of $1.54 billion (author assumption, derived from available SEC revenue facts) and a 20% free-cash-flow margin after maintenance capex, yielding approximately $308 million of annual free cash flow. In a base case, assume the same revenue base with a 30% margin, yielding roughly $462 million. In a bull case, assume a 40% margin, yielding roughly $616 million. Discounting these at a 10% rate over a decade and applying the same $922.3 million of debt and $1.1 million of cash yields illustrative equity values ranging from low single-digit billions to mid-single-digit billions, which is consistent with the dated market capitalization at the base case and above the dated market capitalization at the bull case. None of these are audited fair values; they are normalization sketches to test whether the price already prices in the cycle. The result is that the dated market capitalization requires a base-to-bull case outcome to be defensible, which means the market is paying for cycle persistence rather than a margin of safety. The bear case would imply the equity is worth meaningfully less than the dated price.
Five Value-Investing Lenses
Benjamin Graham Lens
Gulfport fails the conservative investor's downside floor. The company emerged from Chapter 11 on May 17, 2021, and the available filings reflect the post-emergence balance sheet, but the capital base remains dominated by $922.3 million of debt against just $1.1 million of cash, with $1.83 billion of stockholders' equity. Graham would have asked whether net current assets provide a cushion; here, current assets of $220.9 million are dominated by $114.4 million of receivables and $82.2 million of short-term derivative assets, and current liabilities of $383.2 million include $139.7 million of revenue payable and $73.9 million in accrued capital expenditures, so the net-net cushion is small. Normalized earnings power is unobservable because the second quarter was inflated by a $61.7 million net derivative gain, while the first quarter of 2026 showed a much smaller derivative impact, and the prior-year fourth quarter showed a $315 million operating loss. A famous producer in a tight gas market is not evidence of cheapness. This is a speculation-priced business, not an investment-priced one, and the price does not provide the Graham margin of safety on available facts.
Benjamin Franklin Lens
Franklin's discipline, applied here, asks whether management is treating shareholder capital with thrift and whether the opportunity cost of buybacks and growth is rational. The company executed $242.3 million of repurchases in six months at an average $192.91 per share, while quarter-end cash was $1.1 million, meaning buybacks were substantially debt-funded. The opportunity cost question is whether $242 million of repurchases at a price-to-book above 1.0x generates more long-term per-share value than debt reduction or accelerated acreage capture. Management is also running a $140 million 2026 discretionary acreage program plus $395 million of operated drilling and completion capex. Thrift here is selective: management is disciplined about hedging and the debt mix, but aggressive about both growth capex and buybacks simultaneously. The result is capital discipline in some dimensions and capital enthusiasm in others, with the balance sheet absorbing the risk.
Warren Buffett Lens
Buffett would focus on durable cash generation, owner earnings, moat and capital allocation. The Q2 2026 operating cash flow of $149.9 million less the implied segment capital expenditure of about $198.5 million yields a negative cash flow after capex for the quarter, so a true owner-earnings proxy is not constructible on a single quarter without double-counting the prior period's $313 million of half-year additions. What is constructible is the half-year operating cash flow of $442.8 million minus the half-year cash capex of $312.8 million, or about $130 million of free cash flow before debt service and buybacks, which is a useful accounting proxy but not a labeled "owner earnings" figure because the filing does not separate maintenance from growth capex. The moat question is unresolved: the company is a commodity price taker with hedge overlay, not a unique asset owner. Capital allocation is mixed: management is both buying back stock aggressively and drilling aggressively, with debt rising from $788.2 million at year-end to $922.3 million at quarter-end. Buffett would likely pass.
Charlie Munger Lens
Munger would invert the question and ask what could permanently impair the equity. First, a sustained gas price decline below hedge floors would compress cash flow while leaving the debt service unchanged; with $922.3 million of debt and only $1.1 million of cash, refinancing risk in a credit crisis is real. Second, leadership turnover creates execution risk; a new CEO and departing CFO during a high-tide gas market is precisely the moment when the next management cycle becomes important. Third, the $1.5 billion repurchase authorization was approved under prior management and may not reflect the new CEO's capital priorities; the market has not yet seen how Domenic J. Dell'Osso, Jr. will allocate capital under a sustained downturn. The bias check is that the dated share price and the $242 million of buybacks at $192.91 average create an incentive to keep buying back even if the right answer is to delever. Munger would ask whether management can resist that bias.
Li Lu Lens
Li Lu would evaluate whether this company sits inside the circle of competence and whether the moat and culture are durable. The Utica/Marcellus and SCOOP positions are within the conventional circle of competence for a natural-gas-weighted producer, but the company's investment thesis depends on the ability to predict and execute through a commodity cycle, which is a notoriously difficult task. Culture is observably mixed: the company emerged from bankruptcy in 2021, has executed an aggressive repurchase and growth program, and is now experiencing meaningful leadership turnover. The durability question is whether the lease base and drilling inventory can support a decade of mid-cycle cash generation; the filing does not disclose reserves or PV-10 in the cited excerpts, so this is unverified. Permanent-loss control depends on the debt level relative to mid-cycle cash flow, and at $922.3 million of debt with no cash, mid-cycle cash flow would need to comfortably exceed debt service to avoid a forced sale or refinancing crisis. This is not a textbook Li Lu situation; the circle is present but the durability is unverified.
Risks, Disconfirming Evidence, and What Would Prove This Thesis Wrong
Prominent growth narratives can amplify attention bias and the price investors are willing to pay before cash flows arrive. That does not negate the operating evidence, but it raises the burden of proof for valuation and makes execution shortfalls more costly. The principal risks are commodity price exposure, debt structure and management execution. A sustained 30%+ decline in natural gas prices would compress realized prices, force hedge restructuring and impair the cash flow that supports both the drilling program and the buyback. Leadership turnover is the second risk; the new CEO took office on May 28, 2026 and the CFO is departing effective August 5, 2026, creating a window in which capital allocation discipline may be tested. The third risk is balance-sheet fragility; with $922.3 million of debt and $1.1 million of cash, the company is essentially fully debt-funded, and a credit market tightening could force a refinancing discussion on the 2029 Senior Notes.
Three observable thesis breakers are worth naming. First, if the natural gas strip price falls by 30% or more for a sustained period without offsetting volume growth, the dated market capitalization is no longer defensible. Second, if the new CEO and incoming CFO reduce or pause the buyback program and prioritize debt reduction instead, that would signal a culture shift toward balance-sheet defense rather than capital return. Third, if the company's reserves or PV-10 fall short of expectations when next disclosed, the embedded cycle assumption in the price is broken. The most likely wrong assumption is that hedge gains and tax benefits are structural rather than cyclical; they are not, and a return to normalized derivatives and tax rates would meaningfully reduce reported earnings power.
Investment Conclusion
The dated market capitalization of $2.9 billion at $163.75 per share as of October 16, 2026 appears to already price in a base-to-bull case mid-cycle outcome for natural gas and assumes the buyback program can be executed without balance-sheet stress. The dated share price does not provide a margin of safety on the available facts. With $922.3 million of debt, $1.1 million of cash, an aggressive debt-funded buyback program, leadership turnover, and one-time tax and derivative tailwinds in the most recent quarter, this is not a textbook value investment. The investment conclusion is Overvalued pending better evidence. The reader should treat this as a cycle-priced equity that requires a normalized commodity environment to defend its price, and the date of the price is October 16, 2026.
This analysis is provided for educational purposes only and is not investment advice. Past performance is not indicative of future results. The reader should conduct independent research and consult a qualified financial advisor before making any investment decisions.
Share this article