The investment case — and what could go wrong
- Net earnings attributable to Kroger were $641 million, or $1.05 per diluted share, versus $609 million and $0.91 a year earlier.
- The largest observable segment risk is fuel margin volatility, which is acknowledged but not quantified for the quarter.
- Where the issuer reports cash flow and capital expenditure cumulatively, the standalone-quarter cash-flow figures are derived by subtracting the preceding cumulative filing.
Selected from this article · 2026-09-19
Read on for the full pictureThe Quarter in Context

Kroger's second fiscal quarter ended August 15, 2026, generated sales of $34.6 billion, up about 2.0% year-over-year, and operating profit of $971 million, or 2.80% of sales, compared with $863 million and 2.54% in the prior-year quarter. Net earnings attributable to Kroger were $641 million, or $1.05 per diluted share, versus $609 million and $0.91 a year earlier. Two-quarter sales reached $80.7 billion and operating profit $2.4 billion (2.94% of sales), with diluted EPS of $2.51 against $2.20 in the prior-year period. The improvement was driven by lower OG&A and depreciation as a share of sales and a smaller LIFO charge, partly offset by a lower FIFO gross margin rate.
Cash generation was weaker than a year ago. Operating cash flow for the first two quarters was $3.1 billion, down from $3.7 billion in the comparable 2025 period, while capital expenditure rose to $2.4 billion from $2.0 billion. The standalone second-quarter operating cash flow of $1.311 billion is an author calculation derived by subtracting the prior cumulative filing from the two-quarter total; it is not a separately reported line item. The quarter also carried $1.058 billion of share repurchases and $216 million of dividends, bringing two-quarter capital returned to roughly $1.7 billion. The market snapshot dated September 18, 2026, places Kroger's market capitalization at about $37.1 billion and the last sale at $60.56 per share. The trailing-twelve-month accounting free-cash-flow proxy of $2.384 billion is the figure used in the valuation analysis.
Business Model and Profit Engine
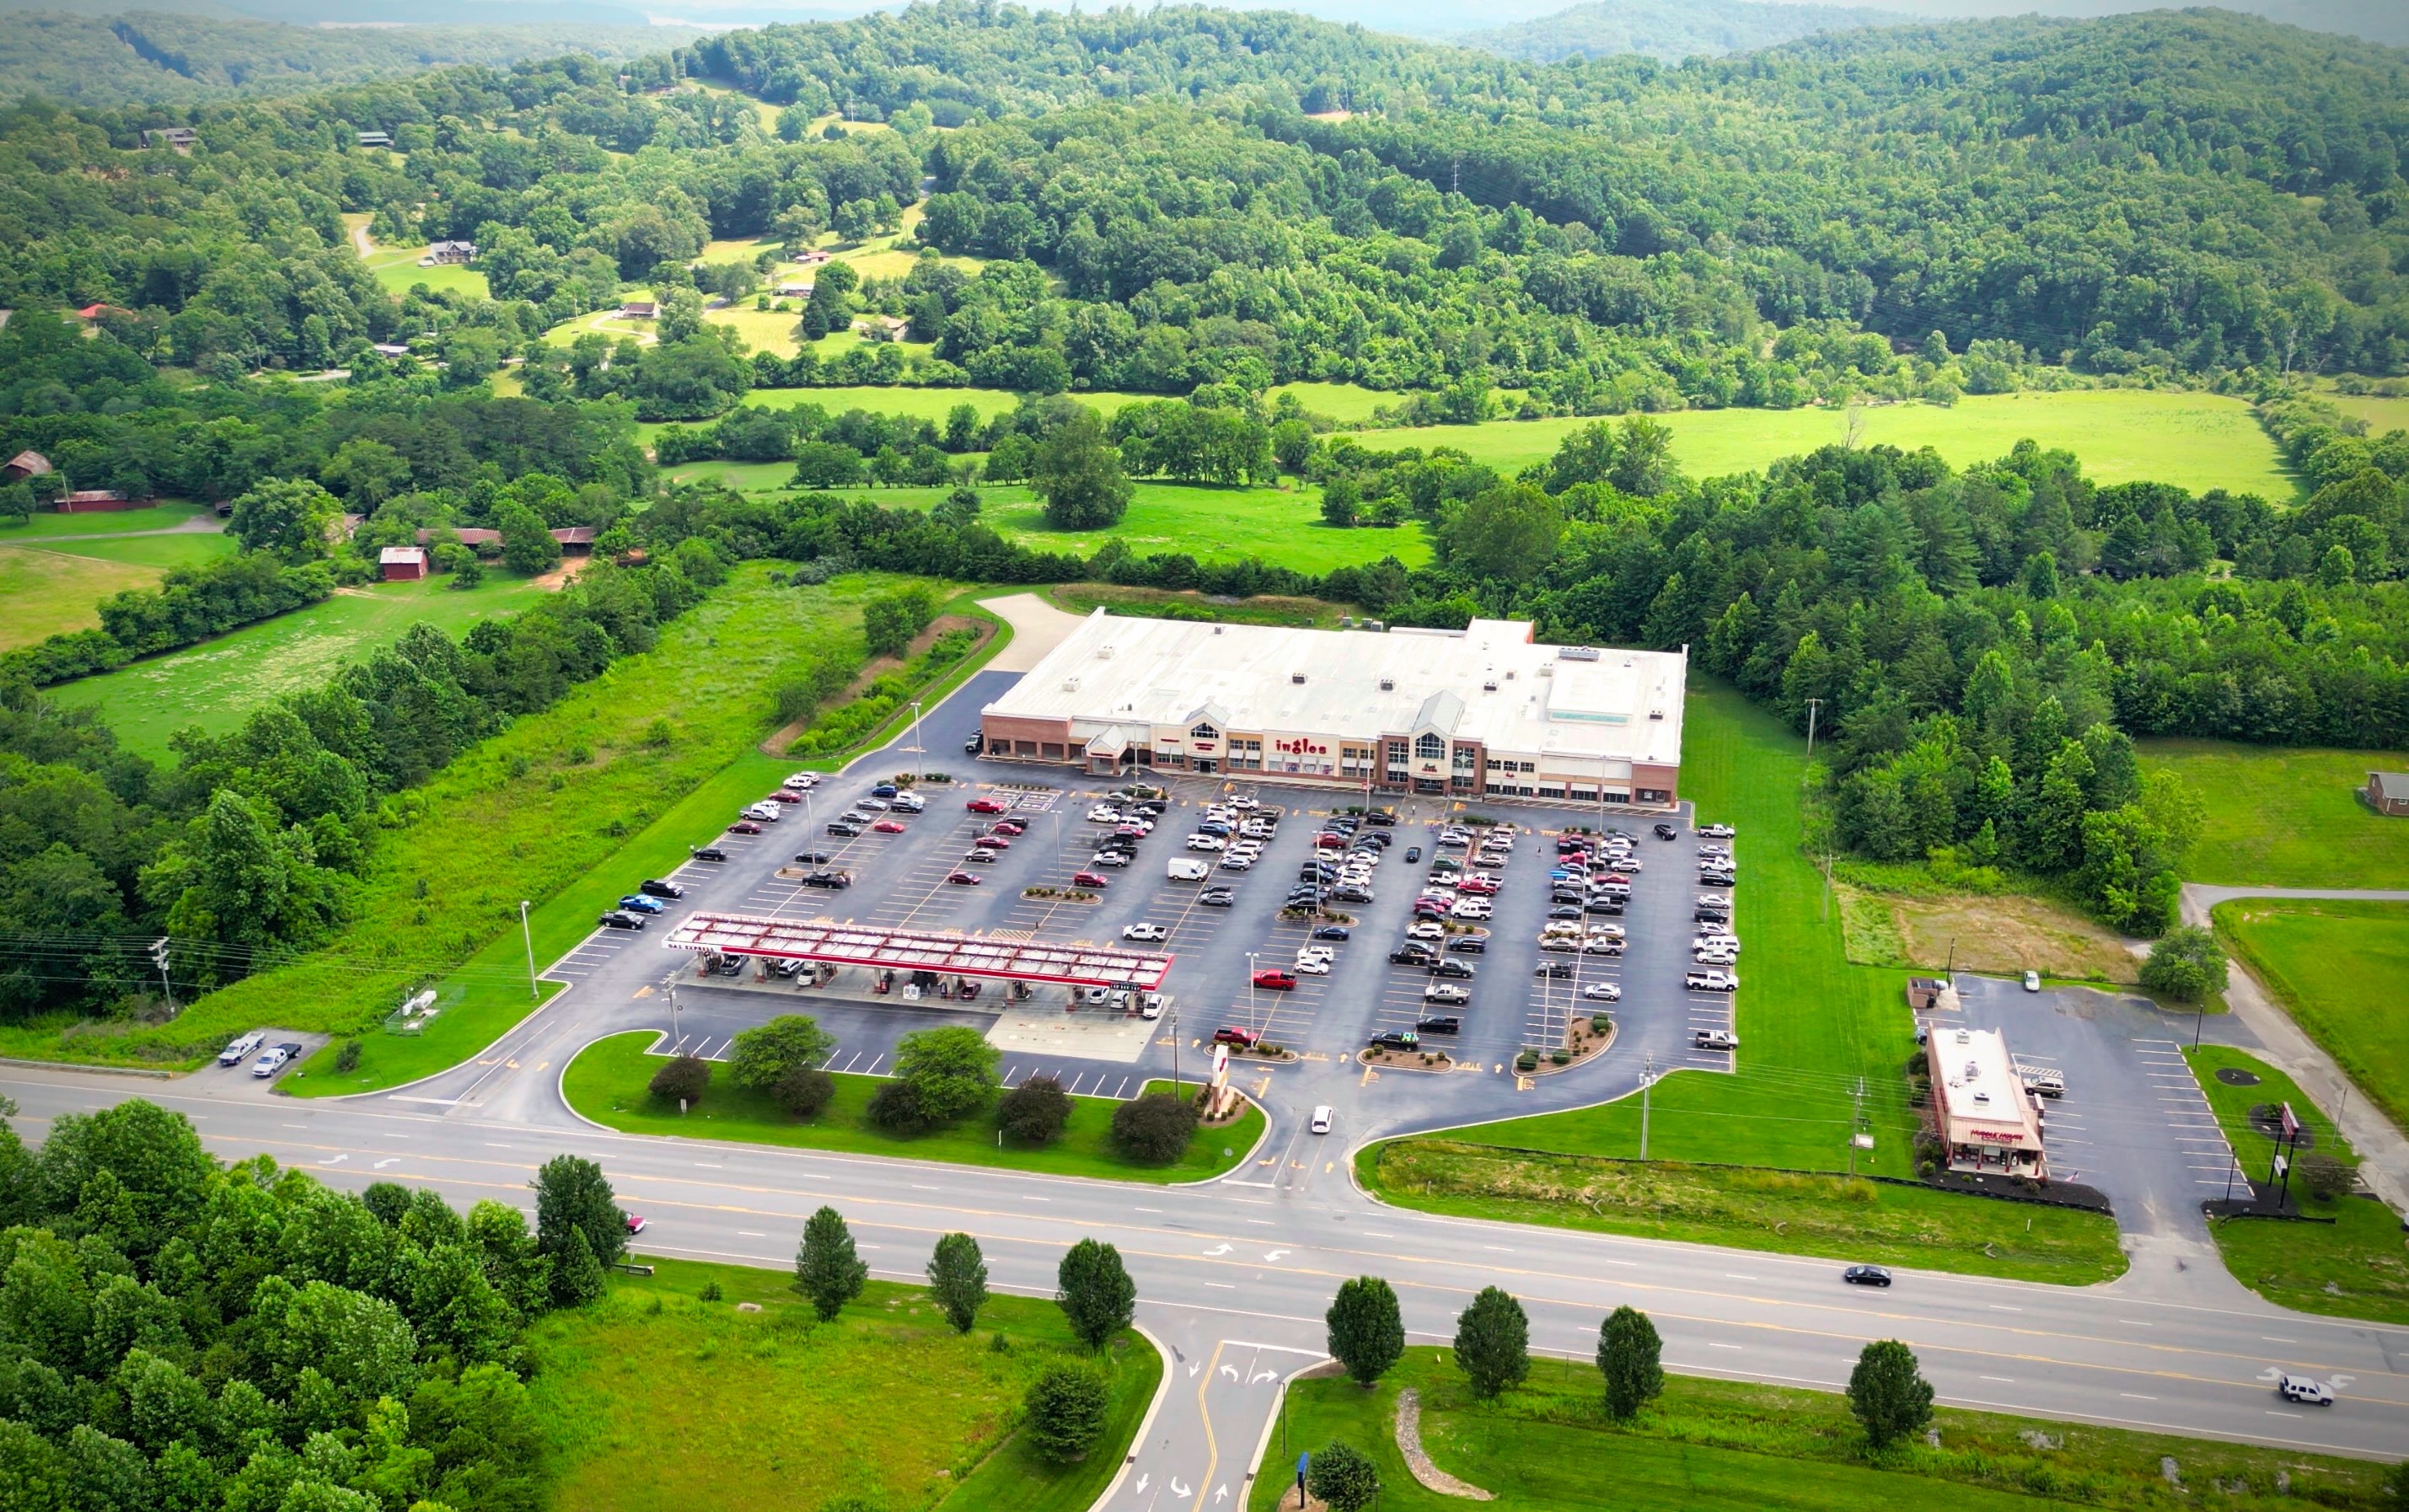
Kroger earns revenue predominantly from selling food, consumables, pharmacy items and fuel to roughly 63 million households annually, with sales generated in stores, online via Pickup and Delivery, and through approximately 1,731 fuel centers. Customers pay for one-stop convenience and fresh-food assortment; the company describes its offering as anchored in Fresh, Our Brands, Personalization and eCommerce, with over $39 billion of sales in fiscal 2025 coming from Our Brands. Recurring revenue is high because grocery trips happen weekly, although the average ticket is modest and largely transactional in nature. A growing slice of profit comes from alternative-profit businesses such as Kroger Precision Marketing, which leverages first-party loyalty data from more than 95% of transactions to monetize retail media and advertising.
Revenue becomes profit through a relatively thin grocery chain. In Q2, merchandise costs of $26.8 billion consumed about 77% of $34.6 billion of sales, leaving operating expenses of $5.95 billion, rent of $198 million and depreciation of $737 million to produce $971 million of operating profit. The model is fixed-cost heavy (store labor, occupancy, depreciation) and therefore shows operating leverage when sales rise and deleverage when sales stagnate; the filing explicitly flags "supermarket sales deleverage" as a drag on Q2 OG&A. Working capital is structurally negative because accounts payable of $10.8 billion exceeds FIFO inventory of $9.9 billion, generating a modest cash float. Capital intensity is meaningful but visible: $2.4 billion of capital expenditure in two quarters funded 35 new, expanded, relocated or acquired stores and 272 remodels.
Profit engine health varies by segment, but the 10-Q does not break out gross margin or segment economics beyond company totals. The filing does confirm that fuel operating profit increased in the first two quarters, that LIFO charges were $91 million versus $102 million, and that adjusted FIFO operating profit excluding special items was $2.62 billion versus $2.61 billion. Conditions that would weaken the profit engine are visible in management's own commentary: a lower FIFO gross margin rate, deleverage on a flat top line, planned investments in associates, and higher healthcare costs. The largest observable segment risk is fuel margin volatility, which is acknowledged but not quantified for the quarter. Pricing power is real but constrained by Walmart, Costco, Aldi, regional grocers, dollar stores, and pure-play delivery operators, all of which compete for the same grocery dollar.
Earnings Quality and Cash Conversion
Where the issuer reports cash flow and capital expenditure cumulatively, the standalone-quarter cash-flow figures are derived by subtracting the preceding cumulative filing. They are calculations from SEC facts rather than separately reported quarterly line items. Reported earnings include several one-time items that should be examined before inferring underlying run-rate. Management's adjusted FIFO operating profit, which adds back $151 million of year-to-date special items (including $119 million of transformation costs and $38 million of merger-related litigation charges), was $2.62 billion versus $2.61 billion a year ago. The reported operating loss in Q3 fiscal 2025 of ($1.54) billion reflects an unusually large charge quarter that does not represent the ongoing business; the 10-Q excerpt confirms charges for asset impairment, store closure, labor dispute, and merger-related litigation in that period, so adding those charges back is appropriate. On the same-quarter income-statement metrics, Q2 FY2026 operating profit was $971 million versus $863 million in Q2 FY2025, and on a two-quarter basis the unadjusted operating profit grew from $2.185 billion to $2.378 billion, roughly an 8.8% increase. The adjusted FIFO comparison across the same two-quarter periods shows $2.62 billion versus $2.61 billion, essentially flat. The filing's own discussion flags a lower FIFO gross margin rate, partly offset by cost savings.
Cash conversion looks acceptable but is not exceptional. Two-quarter operating cash flow of $3.085 billion against $2.437 billion of capital expenditure produces an accounting free-cash-flow proxy of about $0.648 billion for the first half (calculated by the author as operating cash flow minus capital expenditure as reported on the cash-flow statement); the trailing-twelve-month accounting free-cash-flow proxy of $2.384 billion is the figure used in the valuation analysis. The limitation is that the filings do not separate maintenance capex from growth capex, so this proxy does not isolate the cash available after maintaining the existing store base. Stock-based compensation of $101 million year-to-date is small relative to operating profit, so dilution from share-based pay is not a meaningful earnings-quality concern. Share repurchases of $1.3 billion year-to-date meaningfully reduced the share count (diluted weighted-average shares fell to 608 million in Q2 from 665 million a year earlier), which is a tailwind to per-share metrics but also a real claim on cash. Trailing-twelve-month operating cash flow is down roughly 14.8% year-over-year while trailing-twelve-month capital expenditure is up roughly 23.8%, a combination that compresses the free-cash-flow proxy and is a central disconfirming signal against a smooth continuation thesis.
Business Quality, Moat, and Industry Position
Kroger is one of the largest grocery operators in the United States, with 2,697 supermarkets across 35 states at fiscal year-end 2025 and over 63 million households served annually. The moat rests on four observable pillars: a dense multi-format store footprint that is hard to replicate, a 20-year investment in customer data and loyalty that monetizes through Kroger Precision Marketing, the Our Brands private-label portfolio (over 13,000 items averaging more than $39 billion in fiscal 2025 sales), and an integrated eCommerce network offering Pickup at 2,408 stores plus Delivery across substantially all stores. The 10-K describes Kroger as "diversified across brands, product categories, channels of distribution, geographies and consumer demographics," which is a fair summary of why the business has been resilient for more than a century.
The competitive environment is not benign. Walmart, Costco, Aldi, regional grocers, dollar stores, and pure-play delivery operators all compete for the same grocery dollar; fuel margins are volatile and exposed to refining and crack-spread cycles. The 10-K itself lists numerous risks, including labor negotiations, multi-employer pension obligations, competitive pricing pressure, and litigation relating to the terminated Albertsons transaction and opioid settlements. Kroger's good faith effort to grow alternative profit revenue is real, but the segment is not separately disclosed and its standalone economics cannot be verified from the filing. Within the consumer-staples industry, Kroger sits as an important participant in grocery distribution rather than as a single-product bottleneck supplier; its pricing power is real but constrained, and unit-economic disclosure is limited.
Management and Capital Allocation
Kroger returned substantial cash to shareholders in the first two quarters: $1.3 billion of buybacks at an average price of $60.63 per share, and $431 million of dividends, against $3.1 billion of operating cash flow. With $1.7 billion of cash and a stated $2.75 billion revolver (plus a $2.0 billion accordion), liquidity is adequate, and the company repaid $500 million of 3.5% senior notes year-to-date. On the 10-Q balance sheet, current portion of long-term debt including finance leases is $1.838 billion and long-term debt including finance leases is $15.159 billion, so total debt including finance leases is $16.997 billion; the standardized XBRL snapshot separates current debt at $1.452 billion and long-term debt at $13.915 billion, totaling $15.367 billion excluding finance leases. Net cash position using the standardized snapshot is negative $13.691 billion (debt minus cash). Management has guided to roughly flat 2026 capital investment versus 2025, which is consistent with the current run-rate.
Capital allocation tilts toward shareholder return, with a December 2025 $2.0 billion repurchase authorization of which $801 million remained at quarter-end and a 1999 program funded by option exercises. The dividend was raised to $0.39 per share in Q2 from $0.35 in prior quarters, a modest step-up. Acquisitions are a stated priority (Giant Eagle is mentioned as a pending transaction in the liquidity section), which would consume incremental capital and add integration risk. The incentive structure (restricted stock and stock options disclosed in the 10-K exhibits) aligns with shareholder value but adds a measured amount of dilution.
Valuation and What the Market Already Expects
The dated market capitalization of $37.1 billion, combined with the standardized-snapshot debt figure of $15.4 billion and $1.7 billion of cash, implies an enterprise value of roughly $50.8 billion; the market-cap date is September 18, 2026, while the balance-sheet snapshot date is August 15, 2026, a period mismatch the reader should keep in mind. Against the available trailing-twelve-month accounting free-cash-flow proxy of $2.384 billion, the market is pricing Kroger at an unlevered cash-flow yield of approximately 4.7%, which is rich for a low-single-digit-growth grocery business. Trailing-twelve-month operating cash flow is down 14.8% and trailing-twelve-month capital expenditure is up 23.8% versus the prior-year period, which compresses the available cash conversion profile and is the primary driver of the overvaluation conclusion.
The dividend yield is modest (roughly 1.3% based on the new $0.39 quarterly payout and the current price), and buyback yield, while meaningful in absolute dollars, is not free because it is funded with debt and limited cash. The qualitative implication is that the dated market price is paying for near-bull-case execution rather than for a margin of safety. Without a same-date balance sheet, the table below carries the same August 15, 2026 net-cash figure from the standardized snapshot, and readers should treat it as a best-available approximation rather than a same-date bridge.
Ten-Year Cash Flow to Fair Market Value
The starting free cash flow is the normalized SEC cash-flow proxy, while every growth rate, discount rate and terminal rate below is an explicit editorial assumption rather than company guidance. Each annual cash flow is forecast and discounted separately; terminal value is year-ten free cash flow multiplied by one plus terminal growth, divided by discount rate minus terminal growth, and then discounted back ten years. Fair market capitalization equals that explicit ten-year present value plus discounted terminal value and a same-date balance-sheet adjustment when available. If current cash and debt facts do not share one report date, the table shows the adjustment as unavailable and conservatively applies zero. The share count is derived from the dated market capitalization and share price so US shares and foreign ADRs use a consistent traded-security denominator.
Year | Bear FCF | Base FCF | Bull FCF |
|---|---|---|---|
1 | $2.34B | $2.48B | $2.62B |
2 | $2.29B | $2.58B | $2.88B |
3 | $2.24B | $2.68B | $3.17B |
4 | $2.2B | $2.79B | $3.49B |
5 | $2.15B | $2.9B | $3.84B |
6 | $2.18B | $2.99B | $4.03B |
7 | $2.21B | $3.08B | $4.23B |
8 | $2.24B | $3.17B | $4.44B |
9 | $2.27B | $3.26B | $4.67B |
10 | $2.3B | $3.36B | $4.9B |
Scenario | Growth years 1–5 / 6–10 | Discount | Terminal | 10-year PV | Terminal PV | Balance-sheet adjustment | Fair market cap | Fair value/share | Margin of safety | Terminal share |
|---|---|---|---|---|---|---|---|---|---|---|
Bear | -2.0% / 1.3% | 11.0% | 2.0% | $13.2B | $9.19B | -$13.7B | $8.74B | $14.3 | -324.7% | 41.0% |
Base | 4.0% / 3.0% | 9.0% | 3.0% | $18.4B | $24.4B | -$13.7B | $29B | $47.4 | -27.7% | 57.1% |
Bull | 10.0% / 5.0% | 8.5% | 3.5% | $24B | $44.9B | -$13.7B | $55.2B | $90.1 | 32.8% | 65.1% |
In the reverse-DCF, holding the 9% discount rate and 3% terminal growth fixed, and solving only for one constant growth rate rather than using the base-case growth path, the current market capitalization implies roughly 5.8% annual free cash flow growth for ten years. This is a sensitivity framework, not a price target: the terminal-value share shows how strongly each result depends on assumptions beyond the explicit forecast. Negative margin of safety means the current market capitalization exceeds the scenario value.
Five Value-Investing Lenses
Benjamin Graham Lens
Kroger passes the basic financial-stability tests at the security level: it is a large-accelerated filer with positive earnings and dividend continuity, and shares are well above a penny-stock universe. However, Graham's downside test is more demanding. Trailing twelve-month free cash flow of $2.384 billion against an enterprise value near $50.8 billion gives an unlevered yield of roughly 4.7%, which is below the kind of double-digit cash-flow yield Graham typically required to establish a margin of safety. Tangible book value of $2.37 billion is trivial against $37.1 billion of market capitalization, so there is no asset-value floor protecting the equity. Graham would call this a speculation-grade price for what is fundamentally a high-quality, low-growth business, not an investment with downside protection.
Benjamin Franklin Lens
Franklin's modern lessons translate into capital discipline and opportunity cost. Kroger returned $1.7 billion to shareholders year-to-date while running a net debt position of roughly $13.7 billion and incurring $365 million of net interest expense in just six months. At the same time, management is contemplating the Giant Eagle acquisition and ongoing technology transformation, both of which will compete with buybacks for capital. The opportunity cost question is whether buyback-funded EPS accretion or the dividend step-up to $0.39 per quarter is the better use of cash than debt reduction, which would lower interest expense and increase the cushion against operating volatility. Kroger's current mix leans toward shareholder return at the expense of balance-sheet repair, which is a Franklin-style trade-off worth questioning.
Warren Buffett Lens
Buffett would look for three things: durable owner earnings, a sensible moat, and shareholder-friendly capital allocation. Kroger produces real cash (TTM FCF proxy of $2.384 billion), possesses a durable moat through scale, loyalty data, and private label, and returns capital through buybacks and a rising dividend. Reported trailing-twelve-month operating cash flow less total reported capital expenditure produces an accounting free-cash-flow proxy of $2.4 billion. The filings do not separate maintenance from growth capital expenditure, so a precise owner-earnings estimate is unavailable. Even so, $2.384 billion of free cash flow against an equity value of $37.1 billion is a yield Buffett historically would not have paid for a low-growth, leveraged retailer. The business looks understandable, but the price is not.
Charlie Munger Lens
Munger would invert the question: what would break this thesis? First, a sustained period of negative same-store sales combined with supermarket-sales deleverage would compress margins further from the already-thin 2.8% operating margin. Second, fuel-margin compression or a regulatory shock to pharmacy reimbursement could remove a meaningful earnings contributor, given how much of Kroger's adjusted profit growth has come from fuel and pharmacy. Third, leverage is high; a 100-basis-point rise in interest rates would meaningfully pressure net income given $365 million of current half-year interest expense. Munger would also note that management's enthusiasm for the Giant Eagle deal adds integration risk at the same time the industry faces secular pressure from discount competitors. The opportunity cost is that an investor can buy higher-quality consumer staples or investment-grade fixed income with more defensible cash flows.
Li Lu Lens
Li Lu would test the circle of competence, culture, and permanent-loss risk. The grocery business is well inside the circle of competence: it is a long-studied, capital-intensive, demand-stable industry. Culture appears strong; Kroger has a documented Code of Ethics, has invested in store remodels and technology, and retains a long-tenured operating team. The permanent-loss risk is most plausibly tied to balance-sheet stress during a recession or a regulatory event affecting pharmacy or fuel economics. Even under the bear scenario's $14 per share fair value, the equity has meaningful downside from current levels, which is not the asymmetric payoff Li Lu would require. Kroger is the kind of business he would watch, not the kind he would buy at this price.
Risks, Disconfirming Evidence, and What Would Prove This Thesis Wrong
The first observable thesis breaker would be sustained same-store sales growth of 3% or more combined with operating-margin expansion above 3.5%, which would meaningfully shift the cash-flow trajectory toward the bull scenario. The second would be a return to materially higher fuel margins or a structural step-up in Kroger Precision Marketing revenue that the filings do not currently quantify; either would lower the implied growth the market is paying for. The third would be a clearly articulated and well-funded debt-paydown program combined with a dividend payout ratio that signals capital discipline rather than capital return. Conversely, persistent negative free cash flow after maintenance investment, a credit-rating downgrade triggered by leverage, or an adverse outcome from opioid or merger-related litigation would force the conclusion toward "Overvalued" more decisively. The most likely wrong assumption is that the dated market capitalization already prices in only 2% revenue growth; the available reverse-DCF analysis suggests it instead prices in materially higher cash-flow growth. The strongest disconfirming signal in the current evidence is the trailing-twelve-month compression: operating cash flow is down 14.8% and capital expenditure is up 23.8% year-over-year, which compresses the trailing-twelve-month free-cash-flow proxy and is the primary driver of the overvaluation conclusion.
Investment Conclusion
Kroger is a well-run, durable grocery franchise with a real moat, but the dated market capitalization of $37.1 billion sits more than 20% above the available base-case intrinsic range and is only supported by the bull scenario. With free-cash-flow yield near 4.7%, leverage of roughly $13.7 billion net, and trailing-twelve-month operating cash flow down 14.8% while trailing-twelve-month capital expenditure is up 23.8%, the dated price does not offer a margin of safety. The conclusion is Overvalued, with Worth watching on any meaningful multiple compression that brings the market price closer to the base scenario.
---
*This article is for educational and informational purposes only and is not investment advice. All figures are sourced from the available SEC filings and market data and are accurate as of the dates indicated.*
Share this article