The investment case — and what could go wrong
- Selling, general and administrative expense jumped to $29.8 million from $21.8 million, so operating income of $35.4 million was slightly below the prior-year $37.0 million despite the higher revenue.
- Douglas Dynamics earns its revenue from two segments that share a common theme of outfitting commercial vehicles with mission-critical attachments.
- Net current debt is positive at the operating-company level, and the company is actively repaying and reborrowing on its revolver, indicating that downside protection from the balance sheet is limited rather than fortress-style.
Selected from this article · 2026-10-19
Read on for the full pictureThe Quarter in Context
Douglas Dynamics closed the second quarter of 2026 with net sales of $214.6 million against $194.3 million a year earlier, a roughly 10.5% increase, while cost of sales rose to $147.9 million from $134.0 million, leaving gross profit at $66.8 million versus $60.3 million. Selling, general and administrative expense jumped to $29.8 million from $21.8 million, so operating income of $35.4 million was slightly below the prior-year $37.0 million despite the higher revenue. Net income was $25.4 million versus $26.0 million, and diluted earnings per share were $1.07 versus $1.09. The quarter also delivered an unusually high stock-based compensation expense of $4.5 million in the three months, a level that recurs in the half-year figures at $7.0 million versus $3.7 million a year earlier.
The cash-flow statement tells a different and more revealing story. Operating cash flow for the quarter, derived from subtracting the first-half cumulative operating figure of $-25.2 million from the prior six-month comparable of $-12.7 million shown in the 10-Q cash-flow statement, is approximately $-24.2 million for the standalone second quarter. That negative cash figure reflects the company's well-documented seasonality, in which inventory and accounts receivable build aggressively ahead of pre-season shipments in the second and third quarters. Trailing-twelve-month operating cash flow remains a positive $62.2 million, and trailing capital expenditure of $13.3 million produces a trailing-twelve-month free cash flow of $48.9 million. Investors who anchor only on the latest quarter of income would miss the seasonal cash conversion pattern entirely.
Business Model and Profit Engine
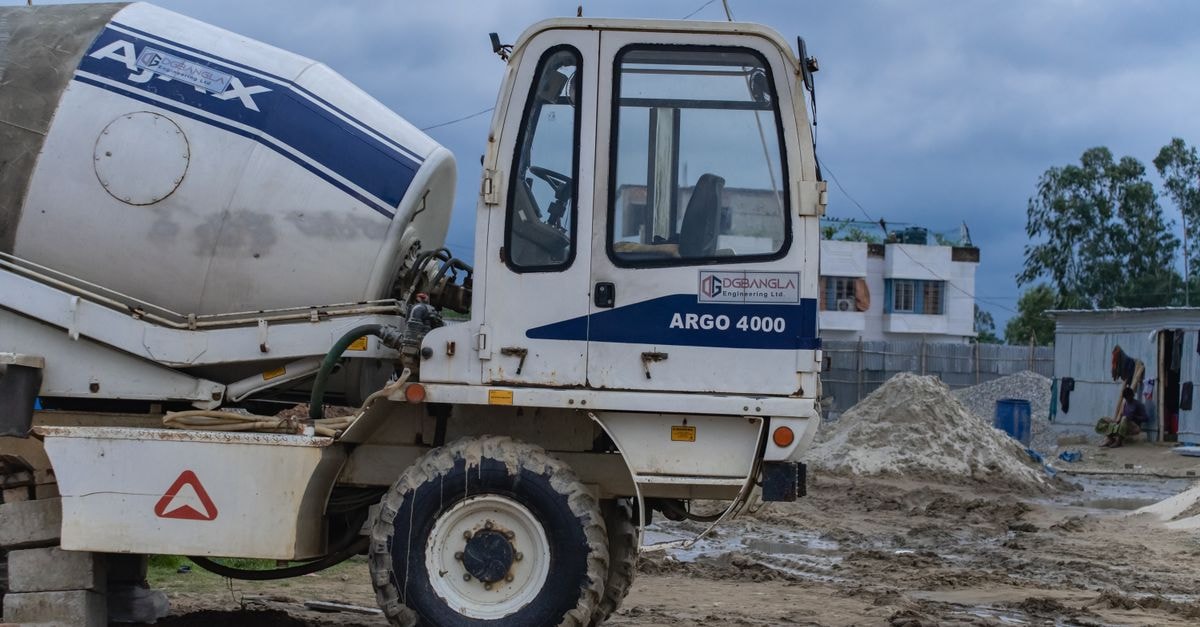
Douglas Dynamics earns its revenue from two segments that share a common theme of outfitting commercial vehicles with mission-critical attachments. The Work Truck Attachments segment generated $129.3 million of the quarter's revenue, almost all of it under the FISHER, SNOWEX and WESTERN snowplow brands, along with the recently acquired VENCO and VENTURO crane and hoist lines. Customers are independent dealers who buy attachments and parts, with the same channel contributing $164.8 million of consolidated revenue in Q2 2026 versus $141.5 million a year earlier. The Work Truck Solutions segment contributed $85.3 million of revenue, sold largely to government buyers ($30.2 million), fleets ($18.3 million) and a long tail of upfit customers, with revenue recognized partly at a point in time ($59.8 million) and partly over time on longer-cycle upfit contracts ($25.6 million).
Who pays and what they buy is, in plain English, professionals whose livelihood depends on plows, spreaders and crane-equipped trucks working in worst-weather conditions. The customer pays a premium because equipment downtime translates directly into lost revenue. That dynamic supports the company's roughly 31.1% gross margin in the latest quarter, unchanged from a year earlier despite tariff- and inflation-driven steel costs that the filing flags as material. Inside the engine, fixed costs include a vertically integrated manufacturing footprint of one owned facility plus twenty-four leased sites, while variable costs are dominated by steel, which the company discloses now accounts for 7.3% of revenue in Q2 2026 versus 5.3% a year earlier. Operating leverage is therefore tight on the upside: when winter is good, pre-season volume flows through the variable structure with limited incremental fixed cost, which is precisely why operating income was only modestly weaker than last year despite the higher expense base.
Pricing power shows up in the company's stated ability to implement both permanent price increases and temporary surcharges when steel costs spike. That is observable evidence of pricing leverage, but the filing also notes the existence of a timing gap between when costs are incurred and when higher prices are realized in backlog, a candid disclosure that limits how confidently the pricing power can be extrapolated. Working capital intensity is the principal capital drag: accounts receivable of $156.6 million and inventory of $175.0 million together consume more than the company's entire $299.7 million of shareholders' equity. A reader should label segment-level fixed-versus-variable economics as only partially disclosed; the filing shows segment revenue and segment adjusted EBITDA, but does not split fixed from variable cost inside each segment.
Earnings Quality and Cash Conversion
Where the issuer reports cash flow and capital expenditure cumulatively, the standalone-quarter cash-flow figures are derived by subtracting the preceding cumulative filing. They are calculations from SEC facts rather than separately reported quarterly line items. Reported second-quarter results were propped up by an unusually high stock-based compensation charge of $4.5 million, which inflates GAAP expenses relative to the prior year and pulls adjusted earnings above GAAP. The adjusted net income reconciliation moves GAAP net income of $25.4 million to $28.9 million by adding back $4.5 million of stock compensation and $0.3 million of other charges, net of tax. That is a non-trivial gap between GAAP and adjusted earnings, and a reader should treat the adjusted figure as a company-defined presentation rather than a clean economic measure of owner earnings. The stock-based compensation itself is a real economic cost that reduces per-share value, so the gap cuts in one direction only: adjusted earnings overstate the cash earned by an owner who must dilute himself to pay the comp.
The cash-conversion story is the more important diagnostic. The filing reports cash used in operations of $25.2 million for the first six months of 2026 against $12.7 million a year earlier. The driver is working capital: accounts receivable increased by $59.4 million in the half-year, inventory by $25.3 million, partly offset by a $8.7 million inflow from accrued liabilities. This is the predictable mechanical consequence of pre-season shipments built up in Q2. Capital expenditures of $7.3 million for the first six months of 2026 versus $5.1 million a year earlier are described as modest, and the filing explicitly notes that capex can be cut by up to 40% in soft-demand years. Because the filing does not separate maintenance from growth capex, this $7.3 million should be labelled an accounting free-cash-flow proxy rather than a maintenance capex figure.
The honest summary of earnings quality is this: Q2 GAAP earnings look clean apart from the stock-comp issue, but the quarter under-reports the company's true cash-generating power. The trailing-twelve-month operating cash flow of $62.2 million converts reported net income of $52.6 million at slightly above 100%, and that trailing figure is the more reliable economic signal than the quarter's standalone net income of $25.4 million.
Business Quality, Moat, and Industry Position
The moat story here is not technological surprise but installed-base replacement economics. The company states a North American installed base of more than 500,000 snowplows and sand and salt spreaders, with the typical plow replaced every 9 to 12 years, and a network of roughly 3,000 points of sale. Replacement is driven by usage and snowfall rather than by technology fashion, so the firm's revenue has structural inertia regardless of which fiscal quarter an investor happens to look at. The 10-year rolling average snowfall range disclosed in the 10-K, between 2,623 and 3,345 inches, gives some empirical grounding to the multi-year consistency claim.
Position within the supply chain is that of a focused midstream manufacturer plus upfitter, not a vertically integrated OEM and not a pure dealer. Substitutability is moderate: snowplows are functionally comparable across brands, but dealer relationships, pre-season financing programs and the data the company has on replacement cycles constitute real switching costs for distributors. The strategic importance is therefore a 3 out of 5 on the framework, an important participant with switching frictions rather than a singular chokepoint such as a tier-one auto supplier or a semiconductor foundry. The Work Truck Solutions side is more transactional and more concentrated on government contracts, including $30.2 million of Q2 2026 government revenue, which is a structurally more competitive bidding environment than the dealer-channel Attachments business.
The principal weakness in the moat claim is the seasonal concentration of operating results in a small number of months. Roughly two-thirds of Attachments revenue in a typical year runs through Q2 and Q3, and Q1 is structurally weak by design. The Work Truck Solutions business diversifies away from snow but introduces a separate vulnerability: large government contract timing can produce lumpy quarters. The acquired Venco Venturo line adds product breadth but also added $0.9 million of additional purchase consideration in the first six months of 2026, evidence that the acquisition economics are still being finalized.
Management and Capital Allocation
Capital allocation in the first six months of 2026 took four observable forms: share repurchases of $6.0 million against a prior authorization of $50.0 million granted in February 2022, dividends of $14.2 million, $52.0 million of net revolver borrowings and roughly $8.2 million of investing outflows including $7.3 million of capital expenditure and $0.9 million for the Venco Venturo working-capital true-up. The dividend stream is a meaningful commitment, running at an annualized level near $28 million against a trailing-twelve-month free cash flow of $48.9 million, so the dividend is comfortably covered but consumes more than half of trailing free cash.
Management's incentives show up in the stock-comp ramp: $7.0 million of stock-based compensation in the first six months of 2026 versus $3.7 million in the first six months of 2025, an 88% increase at a company that is not a high-growth software business. That level of equity comp is a real per-share economic drag that the GAAP income statement already absorbs but that an investor should keep front of mind when comparing PE multiples. The 2022 repurchase plan has roughly $32 million remaining at quarter end, and the only Q2 repurchase activity was 67,532 shares at an average price of $44.42 in May. Share count of 23.07 million outstanding at June 30, 2026 is essentially unchanged from 23.07 million at year-end 2025, so buybacks at recent activity levels have minimal per-share accretion impact.
The sale-leaseback transaction completed in 2024 with $64.2 million of gross proceeds freed up balance-sheet capacity but created a long-dated operating lease obligation of $80.0 million noncurrent plus $9.8 million current at June 30, 2026, an economic obligation that a reader using only GAAP balance-sheet leverage would underestimate. On the question of management candor, the filing explicitly names inflation, tariffs and the war in Iran as cost headwinds and uses the word "may not be able" rather than asserting they will fully recover costs, which is more candid than boilerplate reassurance.
Valuation and What the Market Already Expects
As of the market-data date the public share price was $39.66 and the dated market capitalization was approximately $915.2 million against trailing-twelve-month free cash flow of $48.9 million. That is a free-cash yield of roughly 5.3% on the current price. Because same-date balance-sheet adjustments were not available for net cash or total debt, the equity-value bridge cannot tighten further, and a reader should treat the headline market cap as the dominant number rather than improvising an enterprise-value bridge. Net revolver borrowings of $57.0 million and a current portion of long-term debt of $7.4 million are visible, but long-term debt and total-debt figures for the current quarter are not available in this evidence package.
The qualitative reverse-DCF implication is straightforward: at $39.66 the market is paying roughly nineteen times trailing free cash, which embeds a base-case expectation that free cash flow grows modestly and persists. The deterministic base-scenario reverse-engineered growth embedded in the current price is approximately 4.1%, materially below the 10.5% trailing revenue growth and lower than the historical rate of growth in average snowfall-driven replacement demand. That is consistent with the dated market price being approximately inside the range of a fairly-valued outcome rather than obviously cheap.
Ten-Year Cash Flow to Fair Market Value
The starting free cash flow is the normalized SEC cash-flow proxy, while every growth rate, discount rate and terminal rate below is an explicit editorial assumption rather than company guidance. Each annual cash flow is forecast and discounted separately; terminal value is year-ten free cash flow multiplied by one plus terminal growth, divided by discount rate minus terminal growth, and then discounted back ten years. Fair market capitalization equals that explicit ten-year present value plus discounted terminal value and a same-date balance-sheet adjustment when available. If current cash and debt facts do not share one report date, the table shows the adjustment as unavailable and conservatively applies zero. The share count is derived from the dated market capitalization and share price so US shares and foreign ADRs use a consistent traded-security denominator.
Year | Bear FCF | Base FCF | Bull FCF |
|---|---|---|---|
1 | $48M | $51M | $53.9M |
2 | $47.1M | $53.1M | $59.4M |
3 | $46.3M | $55.3M | $65.4M |
4 | $45.4M | $57.6M | $72.1M |
5 | $44.6M | $60M | $79.4M |
6 | $45.2M | $61.8M | $83.4M |
7 | $45.9M | $63.7M | $87.6M |
8 | $46.5M | $65.6M | $91.9M |
9 | $47.2M | $67.6M | $96.5M |
10 | $47.8M | $69.6M | $101M |
Scenario | Growth years 1–5 / 6–10 | Discount | Terminal | 10-year PV | Terminal PV | Balance-sheet adjustment | Fair market cap | Fair value/share | Margin of safety | Terminal share |
|---|---|---|---|---|---|---|---|---|---|---|
Bear | -1.8% / 1.4% | 11.0% | 2.0% | $0.274B | $0.191B | N/A (treated as $0) | $0.464B | $20.1 | -97.1% | 41.1% |
Base | 4.2% / 3.0% | 9.0% | 3.0% | $0.379B | $0.505B | N/A (treated as $0) | $0.884B | $38.3 | -3.6% | 57.1% |
Bull | 10.2% / 5.0% | 8.5% | 3.5% | $0.496B | $0.928B | N/A (treated as $0) | $1.42B | $61.7 | 35.7% | 65.2% |
In the reverse-DCF, holding the 9% discount rate and 3% terminal growth fixed, and solving only for one constant growth rate rather than using the base-case growth path, the current market capitalization implies roughly 4.1% annual free cash flow growth for ten years. This is a sensitivity framework, not a price target: the terminal-value share shows how strongly each result depends on assumptions beyond the explicit forecast. Negative margin of safety means the current market capitalization exceeds the scenario value.
Five Value-Investing Lenses
Benjamin Graham Lens
The current balance sheet shows stockholders' equity of $299.7 million against goodwill and intangibles of $150.4 million, leaving tangible book value near $149.2 million, while the dated market capitalization is roughly $915 million, so the price is approximately 6.1 times tangible book. That multiple by itself is not extreme for an industrials business, but Graham's discipline requires more than a low tangibles multiple when earnings are cyclical and dependent on a single weather variable. The quarter's reported operating cash flow is deeply negative due to working-capital seasonality; only the trailing-twelve-month figure is positive. Net current debt is positive at the operating-company level, and the company is actively repaying and reborrowing on its revolver, indicating that downside protection from the balance sheet is limited rather than fortress-style. The conclusion is that PLOW does not comfortably clear Graham's margin-of-safety bar at the dated price; the dated price is closer to fairly valued than cheap.
Benjamin Franklin Lens
The modern application here is the discipline of compounding versus current consumption. Douglas Dynamics has returned roughly $20.2 million to shareholders in the first six months of 2026 through $6.0 million of buybacks and $14.2 million of dividends, which together consume approximately 41% of trailing-twelve-month free cash flow of $48.9 million. Capital expenditure of $7.3 million and acquisition-related true-up payments add another roughly 16% deployment, leaving a modest reinvestment buffer. The opportunity cost is whether a buyer at nineteen times trailing free cash earns more from compounding this capital than from alternatives whose earning power is less weather-dependent. The discipline verdict: the company deploys capital in a balanced but not bargain-priced manner, so today's buyer is not paying for an obvious mispricing.
Warren Buffett Lens
The owner-earnings proxy here is the trailing-twelve-month operating cash flow of $62.2 million minus the trailing capital expenditure of $13.3 million, which equals $48.9 million, before any same-date balance-sheet adjustment. Without a same-date cash and debt position, the cash-flow-to-equity bridge cannot be tightened to a precise per-share figure, and that limitation should be labelled rather than guessed around. Quality and capital allocation are reasonable: two segments with installed-base economics, candid disclosure on tariff exposure, modest leverage profile, dividends held roughly flat at $0.30 quarterly. What holds this lens back from enthusiasm is the $7.0 million of first-half stock-based compensation that the owner must dilute himself to fund, a per-share drag that is not visible in adjusted figures. The thesis at $39.66 is acceptable but not the wide-margin opportunity Buffett's framework would reward.
Charlie Munger Lens
The inversion test asks how this investment permanently loses money. The most plausible breakage is two bad winters in a row with elevated steel and freight costs that the company cannot fully pass through, forcing the company to absorb them in margin, while working capital remains tied up in inventory that dealers do not re-order. A second breakage is a credit tightening that closes dealer financing, which the company relies on under bailment and floor-plan agreements, choking the order book before the season even arrives. A third breakage is escalation of tariffs that overwhelms the surcharge mechanism, materially compressing Work Truck Attachments margin. The incentive honesty test passes moderately: management discloses limitations and tradeoffs, the stock-comp ramp is the most aggressive observable practice, and the company is not levered to a financial fantasy. The verdict is that the investment can lose money in plausible weather-macro scenarios but is not exposed to an obvious management-deception failure.
Li Lu Lens
The circle-of-competence question is whether an investor can credibly model demand for a snowplow manufacturer in a multi-year global warming regime. The company itself flags weather, including climate change, as the leading forward-looking risk, and admits that the most recent ten-year rolling snowfall average hit a multi-decade low with the season ended March 2025. Cultural durability is mixed: the firm has survived seventy-five-plus years, runs a focused installed-base franchise, and pays a steady dividend at $0.30 per quarter; the cultural flag is the rising stock-based compensation, which is more aggressive than peers in this category would typically run. Durability looks adequate at the franchise level but vulnerable at the climate-trend level, so the investment belongs inside the circle of competence only for investors willing to underwrite a long-term weather variable that the 10-K itself calls out as a risk factor.
Risks, Disconfirming Evidence, and What Would Prove This Thesis Wrong
Three observable thesis breakers would force a conclusion change. First, a material step-down in trailing-twelve-month free cash flow combined with the same-date market capitalization remaining near the dated level would signal that the dated market price embeds more optimism than the cash machine can deliver. Second, a multi-quarter stretch of inventory build without shipment follow-through, visible through rising inventory relative to revenue and lengthening receivables, would indicate that the replacement cycle is decelerating faster than the company's narrative supports. Third, an escalation of tariffs or steel costs that the surcharge mechanism cannot offset, observable through compressed gross margin in successive quarters, would invalidate the pricing-power claim. A milder but still relevant breaker would be a sustained increase in the stock-based compensation run rate that meaningfully dilutes per-share owner earnings without being offset by repurchase activity.
Visible disconfirming evidence already in the data includes the 88% year-on-year jump in first-half stock-based compensation and the negative standalone Q2 operating cash flow that demands a working-capital release later in the year to validate the trailing figure. Less visible but candidly disclosed in the 10-K is the multi-decade-low ten-year snowfall rolling average as of the season ended March 2025, which is the leading input the user should weigh even though the most recent season was 26% above the ten-year average. A reader should treat the Venco Venturo acquisition working-capital true-up and the $0.9 million additional consideration paid in the first half of 2026 as a signal that the acquisition economics are still being finalized rather than as a stabilizing influence.
Investment Conclusion
The dated price of $39.66 and a market capitalization of approximately $915 million sit close to the central base-case outcome of the available deterministic cash-flow framework, with the bull case implying meaningful upside only if the snow replacement cycle remains durable and the company's pricing power continues to offset tariff and steel inflation. The qualitative pattern is a moderately well-run cyclical industrial business whose owner earnings require working-capital normalization, whose franchise is supported by replacement economics, and whose principal risks are weather and input-cost surprises rather than accounting or governance failure. At a free-cash yield near 5.3% on trailing free cash flow of $48.9 million, the dated price does not provide a margin of safety sufficient to call the equity attractive, but neither does it signal clear overvaluation relative to the available base scenario. The prudent stance is to watch for either a price decline that widens the margin of safety or a multi-quarter cash confirmation that supports the base-case growth assumption already in the price.
This article is for educational and informational purposes only and does not constitute investment advice, an offer to buy or sell any security, or a recommendation to take any specific action. All figures are derived from available SEC filings and market data as of the dates indicated, and past performance is not indicative of future results.
PLACES IN THIS STORY
Explore the destinations behind this report
Isle of Man
Douglas
Continue with our current travel guide to Douglas.
Explore Douglas →Share this article