The Quarter in Context

XPEL reported second-quarter 2026 revenue of $143.1 million, up 14.7% from $124.7 million in the prior-year quarter, while gross margin expanded to 44.1% from 42.9%. Operating income climbed to $23.2 million (16.2% margin) from $19.3 million (15.5%), and net income to $18.0 million (12.6% margin) from $16.3 million. The trailing-twelve-month operating cash flow of $73.9 million tells the more useful seasonal story, while the reported quarter's $30.8 million of operating cash flow (cumulative six-month basis $38.2 million) was overwhelmed by $65.1 million in cash capital spending, almost entirely the $61.3 million property acquisition and construction-in-progress deposits in San Antonio. The quarter is therefore best read as the closing stage of a strategic capital cycle rather than an ordinary operating period.
Geographic diversification is one visible shift. North America contributed 66.0% of revenue (United States 54.9%, Canada 11.0%), while Asia-Pacific grew to 15.4% from 10.5% a year earlier, driven by China revenue that more than doubled to $15.9 million from $7.7 million. That China surge is partly inorganic; the 10-Q describes the September 2025 acquisition of the Chinese aftermarket distributor and a 75% interest in a Chinese manufacturing entity, both now consolidated. Reported diluted EPS of $0.65 compares with $0.59 a year ago, but share count is essentially flat at 27.6 million, so the headline earnings lift is operating, not financial.
Business Model and Profit Engine
Who pays and what they buy. The filings describe XPEL as a supplier of protective films, coatings and related services, primarily to the automotive aftermarket, new car dealerships and original equipment manufacturers, with a smaller non-automotive line that includes architectural and marine surface films. Customers are not named in the filings, so concentration is a data gap. Revenue is split into two products. Product revenue, $111.7 million in the quarter, is dominated by paint protection film at $74.8 million (66.9% of product revenue) and window film at $32.5 million (29.1%). Service revenue of $31.4 million includes installation labor ($25.3 million), software ($2.3 million) and cutbank credits ($1.9 million). The mix shows a hybrid model: a manufacturer/distributor selling consumable film and software patterns, plus a growing captive installation footprint where installers buy kits.
How revenue becomes profit and cash. Gross margin of 44.1% in the quarter and 42.9% over the trailing twelve months reflects the value-add of branded film and proprietary pattern software above commodity film cost. Selling and marketing spend of $15.4 million and general and administrative of $24.5 million together total $39.9 million (27.9% of revenue), yielding the 16.2% operating margin. Inventory of $128.0 million against $260.4 million of six-month revenue and accounts receivable of $53.6 million against $143.1 million of quarterly revenue indicate meaningful working-capital intensity, particularly in finished film inventory, that an investor should normalize for in any cash-flow view. The accounting free-cash-flow proxy of operating cash flow less total capital expenditure is negative in the latest quarter and negative on a trailing-twelve-month basis, but the negative reading is dominated by the one-time real-estate transaction flagged in the filing itself, not by underlying operations.
Unit economics, pricing power and concentration. The 10-K describes a "best-in-class" service strategy that began with independent installers and extended to dealerships and OEMs. That history, plus the proprietary cutbank and software pattern business, hints at switching costs at the installer level, but the filings disclose neither customer concentration, nor average selling-price movements, nor evidence of successful price increases, all of which would be needed to confirm durable pricing power. Observable conditions that would weaken the profit engine include automotive volume contraction, sustained raw-material inflation that the filings flag as unhedged, and an inability to convert the San Antonio and China facilities to cost-competitive in-house production.
Earnings Quality and Cash Conversion
Where the issuer reports cash flow and capital expenditure cumulatively, the standalone-quarter cash-flow figures are derived by subtracting the preceding cumulative filing. They are calculations from SEC facts rather than separately reported quarterly line items. GAAP profitability is clean. Net income of $18.0 million closely tracks operating income of $23.2 million after $5.1 million of tax expense and a small $0.4 million foreign-currency gain; there are no one-time items, impairments or fair-value gains embedded in the quarter. Stock-based compensation of $1.3 million in the quarter and $2.2 million over six months is small relative to revenue, so management's reported earnings are not heavily propped up by non-cash add-backs. A tax benefit can lift reported income, not weaken it; here the small foreign-currency gain and a modest deferred tax movement are explainable but not material.
Cash conversion is the central tension. Operating cash flow of $30.8 million in the quarter trails net income of $18.0 million, a positive sign of working-capital release partly because inventory and receivables grew less than sales. Year-to-date operating cash flow of $38.2 million beats prior-year $31.1 million by 22.8%, consistent with the underlying earnings growth. However, total capital spending of $65.1 million in the quarter is the disclosure's largest line item and almost entirely property-related: land of $10.2 million, buildings of $36.9 million, and construction in progress of $14.2 million for an additional vacant building, plus $12.9 million of manufacturing-equipment construction in progress expected to come online in 2027. The filings do not separate maintenance from growth capital expenditure, so this is an accounting free-cash-flow proxy, not a true maintenance-capex owner earnings calculation; the limitation should be kept in mind.
The funding side is explicit. XPEL drew a $44.8 million ten-year term loan from PNC at Term SOFR plus 1.25% (4.9% at quarter-end), secured by the four San Antonio properties, to finance the real-estate acquisition. The credit facility with Wells Fargo ($125 million capacity) was extended to September 2028 and was undrawn at quarter-end. A $3.2 million Canadian revolver with HSBC was also undrawn. Total debt of $44.8 million against $40.7 million of cash leaves a modest $4.1 million net debt position, but the property debt is structural rather than operational and warrants separate consideration.
Accounting free cash flow remains -$0.0 billion. In a separate, more conservative owner-earnings sensitivity—not an alternate definition of reported free cash flow—treating TTM stock-based compensation of $0.0 billion as an economic dilution cost produces approximately -$0.0 billion. This is an analytical approximation, not a company-reported measure, and it treats compensation paid in shares as an economic cost even though the cash-flow reconciliation adds it back.
Business Quality, Moat, and Industry Position
On the available evidence, the company is best described as an important participant, not a demonstrated core supply-chain bottleneck. This classification describes strategic position only; it is not independent proof of a moat or valuation upside. The protective-film category is a niche industrial specialty with a recognizable brand in the aftermarket. XPEL's filings highlight proprietary pattern software, a network of independent installers, and growing penetration into new-car dealerships and OEMs as the structural advantages. Quarterly product revenue mix shows paint protection film growing 19.4% and window film growing 16.1% year-over-year, both faster than total product growth of 17.8%, suggesting continued category adoption rather than mere pricing. Internationally, China revenue more than doubled, although off a low base, and the Asia-Pacific segment as a whole grew 68.3%.
Competitive durability is partially evidenced, not fully. The 10-K lists competition in the aftermarket as an ongoing risk and acknowledges dependence on a network of independent installers and dealerships that XPEL does not control. Substitutability is real: paint protection film is a discretionary vehicle accessory with alternatives that include ceramic coatings and DIY products. Capacity elasticity is favorable because film extrusion is capital-light relative to integrated auto-parts manufacturing, but the San Antonio and China investments will raise fixed costs and test that elasticity. Qualification barriers for OEM supply are higher, evidenced by OEM traction, and order visibility is short because contracts are typically purchase-order based, with limited remaining-performance-obligation disclosure under the ASC 606 practical expedient. Concentration risk and customer-by-customer revenue are not disclosed, which limits the rigor of any moat claim. On a 0-5 scale of strategic importance, XPEL appears to be an important_participant rather than a structural bottleneck; it is a meaningful, brand-led, but still commodity-adjacent, link in a discretionary vehicle accessory chain.
Management and Capital Allocation
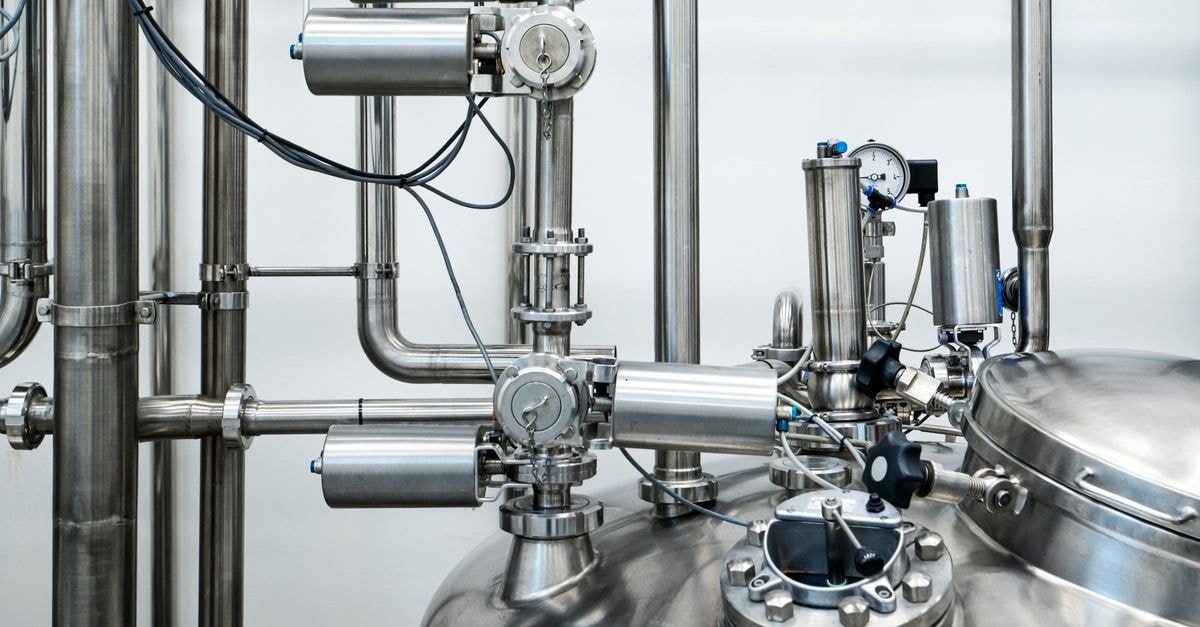
Capital allocation is the dominant theme of 2026. The quarter's largest cash outflow is not an acquisition but a real-estate vertical-integration buildout: $61.3 million to acquire the existing San Antonio storage, fabrication and warehouse facility, plus preparation for in-house paint protection film manufacturing, paired with a 75% interest in a Chinese manufacturing facility. The strategic logic articulated in the 10-Q is vertical integration of the core film supply chain, with a long-tenor property loan (ten years, twenty-five-year amortization) funded by long-life real estate.
Buyback behavior is conservative. A May 2025 authorization of up to $50 million remains with roughly $44.1 million still available; no shares were repurchased in the second quarter, although $2.9 million of treasury shares were purchased in the first quarter. Diluted weighted-average shares of 27.6 million are essentially unchanged year-over-year, so per-share metrics are not artificially lifted by shrinking share count. Dividends are not disclosed in the available XBRL series, so dividend policy is a data gap. Acquisition behavior outside of the China deals includes $7.1 million of business acquisitions net of cash and $14.3 million of non-cash acquisition consideration during the six months, and the goodwill balance rose to $61.3 million from $59.3 million at year-end 2025. No goodwill impairment was recognized in the periods presented. Stock-based compensation expense of $2.2 million over six months and modest net dilution suggest that management's incentive structure is not excessively dilutive, but full grant-level detail would be needed to assess alignment with shareholders.
Valuation and What the Market Already Expects
The dated market data show a last sale of $45.0075 on August 3, 2026 and a market capitalization of $1.24 billion on approximately 27.6 million shares. Trailing-twelve-month revenue of $508.1 million and trailing net income imply a price-to-sales ratio near 2.4x and a rough P/E in the low twenties against $2.08 of trailing diluted EPS, but those multiples are arithmetic shortcuts, not precise earnings power. The trailing-twelve-month accounting free-cash-flow proxy of negative $2.9 million is the binding constraint: at the dated price, the market is paying not for current cash but for a normalization story that includes successful in-house manufacturing, a steady ramp of the Chinese facility, and continued mid-teens revenue growth.
Without a non-positive free-cash-flow base to compound from, the dated price does not yet pass a classic free-cash-flow yield test. The valuation burden, meaning what cash-flow yield the market implicitly requires, is high because operating cash flow of roughly $74 million over the trailing twelve months was entirely consumed by the one-time real-estate build. The reverse-DCF intuition is that the market is paying for a return to mid-teens revenue growth, expanding operating margins toward the high teens, and a sustained mid-single-digit free-cash-flow margin once the new facilities stabilize. Whether that return is realistic is the central question for any prospective buyer.
Ten-Year Cash Flow to Fair Market Value
Direct compounding from the current base is invalid. The trailing-twelve-month accounting free-cash-flow proxy is negative $2.9 million, and the most recent quarter's proxy is negative $34.3 million, so any ten-year projection that simply rolls forward today's cash generation would compound a loss into a larger loss. The filings do not separate maintenance from growth capital expenditure, so this is an accounting proxy rather than a true owner earnings figure, and no deterministic fair value is offered here.
Three author-assumption normalization paths frame the discussion rather than the answer. A bear case assumes year-five revenue at roughly $700 million (a 6.6% CAGR from the trailing-twelve-month base of $508 million) and a 5% free-cash-flow margin yielding about $35 million of annual free cash flow, with a 10% required return implying a year-five free-cash-flow yield of roughly 14%. A base case assumes roughly 10% revenue growth to $820 million at year five with an 8% free-cash-flow margin yielding about $66 million of annual free cash flow and a 10% required return. A bull case assumes 12% revenue growth to $875 million with a 10% free-cash-flow margin yielding about $88 million. Each of these is an author assumption set, not an stated forecasts; the discounted present value at 10% over five years would be a fraction of the current $1.24 billion equity value under both bear and base cases, and only the bull case approaches it. None of these should be read as a price target or as a margin-of-safety calculation. Year-ten cases would compound the year-five results forward and apply an exit multiple, but those assumptions are too speculative to publish in a defensible way.
The qualitative read is that the dated market capitalization already discounts successful in-house manufacturing and continued mid-teens top-line growth. An investor who disagrees with that premise, perhaps because they see execution risk in the San Antonio and China ramp or limited evidence of durable pricing power, would view the dated price as carrying meaningful valuation burden.
Five Value-Investing Lenses
Benjamin Graham Lens
Graham's discipline asks whether the dated price offers a margin of safety against a defensible normalized earning power. Here, net current assets of $191.1 million in tangible book value (stockholders' equity of $306.1 million minus goodwill of $61.3 million minus intangibles of $53.7 million) are well below the $1.24 billion market capitalization, so no obvious asset-based margin of safety exists. Working capital is solid at $139.9 million (current assets of $226.9 million less current liabilities of $86.9 million) and the balance sheet carries only modest leverage of $44.8 million of total debt against $40.7 million of cash, but the property loan is a structural commitment. Speculation versus investment is the key Graham test: at a trailing-twelve-month free-cash-flow base of negative $2.9 million, paying $1.24 billion looks more like paying for a future story than for current earning power, so the price does not yet meet Graham's margin-of-safety discipline. The company is not cheap on a Graham test today.
Benjamin Franklin Lens
Franklin's modern application is about compounding capital through thrift, discipline and the opportunity cost of every dollar. The $61.3 million real-estate acquisition is large relative to a six-month operating cash flow of $38.2 million, so management is committing roughly 1.6 years of operating cash flow to a single strategic bet. The opportunity cost is real: $44.1 million of buyback authorization sits unused, and the same dollars could have returned capital to shareholders or funded smaller, more targeted acquisitions. The discipline test is whether the in-house manufacturing build will produce a return on incremental capital above the cost of the 4.9% term loan plus the opportunity cost of foregone buybacks. The filings do not yet provide a quantified return target, so this is a question to track, not a judgment to make today. Thrift suggests that the absence of a dividend or a meaningful buyback while the company builds factories is a notable opportunity-cost choice that should be tested against future free-cash-flow conversion.
Warren Buffett Lens
The owner-earnings lens begins with normalized cash generation and bridges to enterprise value. A clearly labeled owner-earnings proxy here would be trailing-twelve-month operating cash flow of $73.9 million minus trailing capital expenditure of $76.9 million, which yields the negative $2.9 million accounting proxy cited above. Adjusting for the $61.3 million one-time real-estate transaction (which the filings identify as such) suggests an underlying owner earnings closer to $40-50 million; that is still small relative to the $1.24 billion equity value at a dated share price of $45.0075. Adding $40.7 million of cash and subtracting $44.8 million of total debt leaves enterprise value modestly above $1.24 billion, with no non-trivial hidden value from underutilized assets. The reverse-DCF intuition is that the market is paying for normalized owner earnings approaching $100-120 million within five years, a roughly 7-8% earnings yield at the dated price, which requires both successful vertical integration and continued mid-teens revenue growth.
Charlie Munger Lens
Munger would invert the question and ask what could permanently destroy value. The most plausible answer is execution failure on the San Antonio and China manufacturing build: the filings themselves list capital intensity, raw-material sourcing risk, regulatory and environmental compliance, and China-specific cost pressures as significant risks. A second inversion is incentive alignment: insider ownership and option-driven compensation are not disclosed in the cited excerpts, so it is unclear whether management's incentives reward patient compounding or short-term revenue growth. A third inversion is opportunity cost versus better-understood alternatives in the public market. The bias check is to not be seduced by the apparent cleanliness of the quarter; the headline 14.7% revenue growth and 20.3% operating-income growth are real but are partly enabled by acquisitions, and the China surge is too recent to assess durability. Munger would also note that paying a high-teens P/E for a free-cash-flow base that has just turned negative is the kind of decision that historically produces permanent loss.
Li Lu Lens
Li Lu's framework asks whether the business sits inside the investor's circle of competence and whether culture and durable advantage are observable. The auto-aftermarket protective-film business is a niche industrial specialty that few public investors truly understand; the filings disclose neither installer retention rates nor product win rates nor OEM program pipeline, all of which would be needed to evaluate durable advantage. The cultural signal is mixed: the company has a long-tenured management team led by founder-Chairman-CEO Ryan L. Pape, a $50 million buyback authorization demonstrating capital-return willingness, and a real-estate-financing choice that signals long-term commitment. The risk control test asks whether permanent loss is possible. Yes: a failed vertical-integration strategy could impair both the $61.3 million real-estate investment and $61.3 million of goodwill, a combined $122 million of asset value that is roughly 10% of the dated market capitalization, and additional write-downs of intangibles of $53.7 million are possible. The circle-of-competence verdict is that an investor without deep knowledge of auto-aftermarket dynamics, Chinese manufacturing operations, or specialty film chemistry is at risk of misjudging both the moat and the execution risk here.
Risks, Disconfirming Evidence, and What Would Prove This Thesis Wrong
Three thesis breakers are observable. First, if the in-house manufacturing ramp in San Antonio and China is delayed, fails quality audits, or runs materially over the disclosed $61.3 million property budget, the operating margin and free-cash-flow conversion that the dated market capitalization requires will not materialize. Second, if automotive end-market demand contracts, paint protection film volume is unlikely to grow at the 19.4% second-quarter pace for long because the filings flag the business as highly dependent on the automotive industry. Third, if China-specific cost pressures, regulatory scrutiny or geopolitical disruption erode the Asia-Pacific margin that has lifted overall revenue, the geographic diversification story weakens. The most likely wrong assumption is that mid-teens revenue growth and stable margins will persist simply because they have appeared in a single quarter; the data only support a multi-quarter trend if the manufacturing and international expansions execute cleanly.
Disconfirming evidence already in the filings includes the negative trailing free-cash-flow base, the $4.1 million net debt position created by the property loan, the goodwill and intangibles of $115.0 million that depend on successful acquisition integration, and the absence of disclosed customer concentration metrics. The disclosure itself flags product liability, warranty, raw-material, contract-manufacturer, regulatory and short-seller risks. An investor should treat the apparent cleanliness of the quarter with appropriate caution because the underlying capital cycle is in mid-transition.
Investment Conclusion
The dated market capitalization of $1.24 billion on roughly $508 million of trailing revenue and a near-zero trailing free-cash-flow base prices in a successful vertical-integration strategy and continued mid-teens growth that is not yet visible in cash. Observable evidence supports a competitive aftermarket position and a clean balance sheet, but does not yet support a margin of safety against the dated price. Conclusion: Worth watching, with valuation burden as the dominant constraint. An investor who already owns XPEL has a defensible case based on operating-margin trajectory, geographic diversification and modest leverage, but a prospective buyer should require clearer evidence of free-cash-flow normalization before underwriting the current multiple.
Educational use only. This analysis is for informational and educational purposes and is not a recommendation to buy, sell or hold any security. Market data are dated August 3, 2026; filings are as of August 7, 2026. Past performance does not predict future results.
This article is for research and educational purposes and does not constitute personalized investment advice.
Share this article